


Benchmark #2 – Group Data Analysis (Sp26)
Due by Friday 11:59PM of the Unit 6 – Online Ecology Work Week 1
Before you start: Make sure all group members have completed their individual data collection and individual representations (Benchmarks #1) and uploaded their files into your lab Google Drive group folder prior to meeting with your group. Each person is responsible for contributing their data from their Data Collection Handout (Benchmark #1) to their own group folder. As a group, you will work together to determine how to best compile and organize all your individual data.
- Groups should meet in person to work together on Benchmark #2. Each person should bring their data from 2 trees and study areas (A and B) using the procedure and data collection sheet included in Benchmark 1.
- Use the provided Benchmark #2: Urban Ecology Group Data Analysis Template Sp26 in your shared lab Google Drive Folder to help organize your combined data and interpretations. Once you complete all the components listed below, save as a PDF to upload to your Moodle Lab Site.
- As a group, you will work together to determine how to best compile and organize all your individual data . Your group will compile data from all 8 trees sampled (if the group is made up of 4 students). The two steps below will get you started on compiling your baseline data.
- Compile the observational data (images and observations) on types of trees, lichens commonly seen, other observed organisms, environmental differences….
- Compile each of your individual raw data tables into Group Data tables for each of the data collected. Group data tables may lead to summary data tables for the different data that was collected by your group.
- Reflect on the Procedures performed: Pace to Plant data, DBH, Lichen % Coverage at 4 Cardinal Directions (N, S, E, W compass points), lichen growth forms (types of lichen) and patterns of growth present in the 4 directions and at different heights. You will likely end up with a few different data tables for the different activities. Since different trees in different locations will be sampled, you may want to use percentages when referring to overall surface area in your comparisons.
- What are some unique ways you can compare/contrast your data? Once you have compiled your baseline group data as indicated above, you can move on to discussing the data each group member collected to compare and contrast data.
- The objective is to group data in interesting ways and to find trends or other patterns. Your group data can be grouped and presented in many ways. Remember that your data includes observations of different tree species, locations, DBH, pace to plant impervious surface area around trees, different growth forms of lichen, % surface area coverage of lichen on the 4 cardinal sides of a tree (N, S, E, W) and at 2 different heights. Start with two basic graphs using your compiled group data:
- Graph 1 – Using the group data you compiled from Tables 4.2-2 and 4.2-5 Pace to Plant data, make basic bar graph indicating the % of Impervious Surface Area surrounding each of your trees on one graph incorporating the data from ALL 8 of the group trees sampled.
- Graph 2 – Using the group data you compiled from Tables 4.2-3 and 4.2-6 Lichen Surface Area, make a basic bar graph to represent overall percent lichen surface area at DBH in each of the 4 cardinal directions (N, S, E, W) for each tree species in one graph incorporating the data from ALL 8 of the group trees sampled.
- Additional Graph(s) and Summary Table(s): Now that you have created two basic graphs for the 8 group trees, you are ready to take it to the next level. Examine all of your data, both qualitative (your observations of the trees, species, environment, types of lichens present, other species present, pictures, descriptions, etc.) and quantitative data (Tables 4.2-1 through 4.2.6) to find other ways in looking for patterns and/or comparisons of interest.
- Make at least 1 other graph with your combined group data. You may also want to provide summary table(s) based on your compiled group data that portrays another relationship between the collected data. Here are some ideas to get you started:
- Do you see similar/different patterns in % of lichen coverage between different tree species? Why do you think these differences occur?
- Is there a difference in % lichen coverage vary on the different cardinal sides of the tree (N, S, E, W)?
- Are different growth forms of lichen found in the different cardinal sides of the tree?
- Does lichen coverage differ at 2 feet and at DBH for different species of trees and respective locations? Why?
- Does the origin of the tree species (native vs. non-native) make a difference in the amount lichen present?
- Does the health rating, DBH or height make a difference in lichen coverage? Why might this be a factor? Landscape management?
- Does lichen coverage vary depending on whether trees sampled live in a rural, urban, or suburban area?
- How does % lichen coverage and impervious surface area compare and relate to your tree health rating (H, UH, US)?
- Compare your group data to the findings from the Scale Insect Study results carried out by previous BIO 181 students? (See Scale Insect Infestation study below). Are the data trends the same or different? Why or why not
- NOTE: You may need a combination of summary table(s) and/or graph(s) to fully represent all of the data and data summaries for your groups additional deeper focus. (Refer to Appendix E in your lab manual to help you, and see the LabWrite Data Representations/Graphing.
- Review Best Practices for Graphs:
- Choose an appropriate graph to represent the data.
- Good descriptive title
- Labeled axes with units, as appropriate.
- Include a descriptive legend.
- Be sure to number your Figure(s) for easy reference, e.g., Figure 1, 2; Table 1, 2, etc. (Note that all photos and images are also considered figures.)
- Add all of your images, written observations, and description of findings in your shared lab Google Drive Folder.
- Describe your compiled findings (both quantitative and qualitative). This will help you when you are putting together your Group Final Ecology Presentation of this project.
- Make sure to insert your tables, graphs, and any other images/photos into a document that you submit in Moodle. NOTE: all Images/photos should be saved as jpgs.
- Make inferences based on the data you compiled.
- Point out anything of interest or data outliers.
- Consider the following from the data collection handout:
- Ideal Growing Conditions
- Known Tree Health Concerns
- Wildlife Value
- Discussion points: consider 2-3 of the following points as you look for big picture trends and implications in your compiled group data graphs and summary table(s).
- How do ideal growing conditions or known tree health concerns correlate to observed tree health rating and % surface area of lichen?
- What are the differences/similarities in the organisms observed in and around trees at various environments and locations? Explain.
- What differences/similarities do you see in the trees sampled in terms of: Tree species, tree environment and location, Pace to Plant, DBH, lichen coverage at different heights? Why do you think these differences/similarities occur?
- How does cardinal direction (N, S, E, W) make a difference with respect to % lichen coverage?
- Review the responses you included above, and determine the implications of emerging data trends with respect to overall tree health and landscape management?
- Does the origin of the tree species (native vs. non-native) make a difference in the amount lichen present?
- How do your findings of lichen coverage and impervious surface area compare to the findings from the Urban Ecology and Scale Insect Infestation study found below the yellow assignment box. Are the data trends the same or different? Why or why not?
- How might urbanization and climate change affect tree health, lichen, and insect populations? Why is this important?
- What other abiotic factors, not considered above may affect tree health/growth in urban environments?
- What other urban biotic elements not considered above may affect overall tree health/growth?
Your group should save the finished group work as a PDF before uploading the completed group data representations and inferences in Moodle for the Lab Unit 4.2 Group Ecology Project: Data Analysis and Representations – Group Work. This is due by Friday 11:59PM of the Ecology Work Week 1.
Benchmark #2
Due by Friday 11:59PM of the Unit 6 Ecology Work Week 1.
Use the provided template Unit 4.2 Urban Ecology Group Data Analysis Template to turn in your group compilations and representations in Moodle.
Peer Evaluation of Group Work form – each student should submit this completed form Individually and turn it in on Moodle. It is due by the same due date as the Group Work (Friday 11:59PM of the Unit 6 Ecology Work Week 1).
Urban Ecology and Scale Insect infestation Study:


Tree stress related to impervious surface area around Red Maple trees.
During the Spring 2019, students in BIO 181 carried out an Urban Ecology study that focused on Scale Insect infestation and impervious surface area on the NCSU campus near David Clark Labs. Twelve Red Maple trees were sampled from two locations, six trees from Area A (south side of Dan Allan Parking Deck near the railroad tracks), and six trees from Area B (north side of the Dan Allan Parking Deck between University Towers and David Clark Labs). Impervious surface area data was collected using the Pace to Plant method. Scale insect data was collected using a 1 x 10 cm2 clear grid transparency on the red maple tree trunk. Scale insect surface area data was collected on all 4 cardinal directions (N, S, E, W) and at 2 different heights. The data were consolidated in the graph shown below.
Locations and Data Collection:
Area A: Six Red Maples were sampled on the south side of the Dan Allen Parking Deck on the NCSU campus near the railroad tracks.
 .
.  .
. 
Area B: Six Red Maples were sampled on the north side of the Dan Allen Parking Deck between University Towers and David Clark Labs.

 .
.
 .
. 


Class graph of data collected from 12 trees in 2 NCSU locations – Spring 2019
.

Dale, A. (photograph, 2015). Gloomy Scale, Melanaspis tenebricosa (Comstock), Hemiptera: Diaspididae, NC State Extension Publications. https://content.ces.ncsu.edu/gloomy-scale-1
Dale, A. (image, 2016). Measuring Impervious Surface Cover with the Pace to Plant Technique, NC State Extension Publications. https://content.ces.ncsu.edu/measuring-impervious-surface-cover-with-the-pace-to-plant-technique
Frank, S. D., Klingeman III, W. E., White, S. A., & Fulcher, A. 2013. Biology, injury, and management of maple tree pests in nurseries and urban landscapes. Journal of Integrated Pest Management, 4(1), B1–B14.
Frank, S. D., A. Dale. 2015. Gloomy Scale, Melanaspis tenebricosa (Comstock), Hemiptera: Diaspididae. NCSU Extension Publications. Gloomy Scale. c2001–2011. NC State University: NC Cooperative Extension; [accessed 2018 March]. https://content.ces.ncsu.edu/gloomy-scale-1
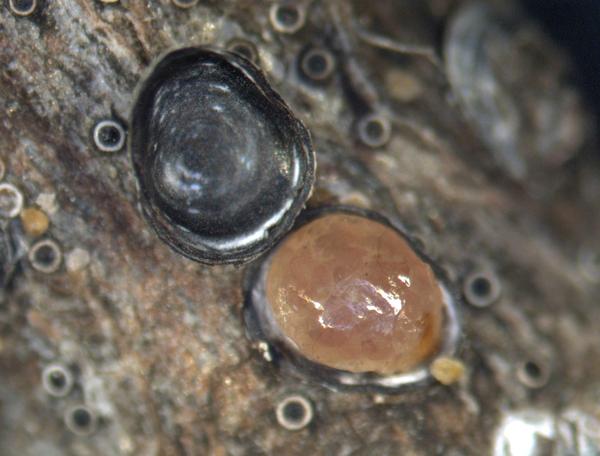
Close up of female scale with test removed (photo by Adam Dale)
Class graph of data collected from 12 trees in 2 NCSU locations – Spring 2019