
Pigments and Photosynthesis
Scroll below for the In-person Lab
TAs will check in with each group to see Outlines for Pathogen Group Projects in Google folders. There should be progress forwards since the Proposals were submitted and graded. All group members should show some meaningful activity.
Read along in your lab handout/lab manual with the information in this webpage. Fill in and answer all questions in Activity 1, Activity 2 and at the end of the lab unit accordingly. Your lab handout will be collected and graded later.
Photosynthesis Lab Handout – Includes areas for filling out your tables and answering questions.
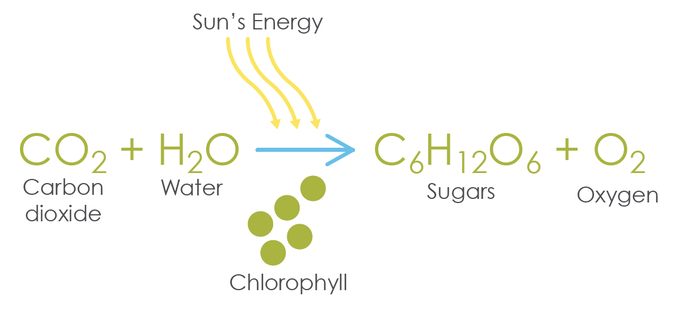
(Balanced equation 6CO2 + 6H2O –> C6H12O2 + 6O2 )

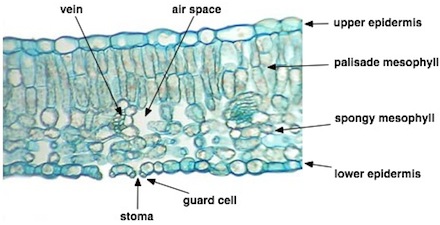
Leaf Anatomy and Photosynthesis:
Leaf Cross section
Structure and Working of Stomata (3:50) – animation
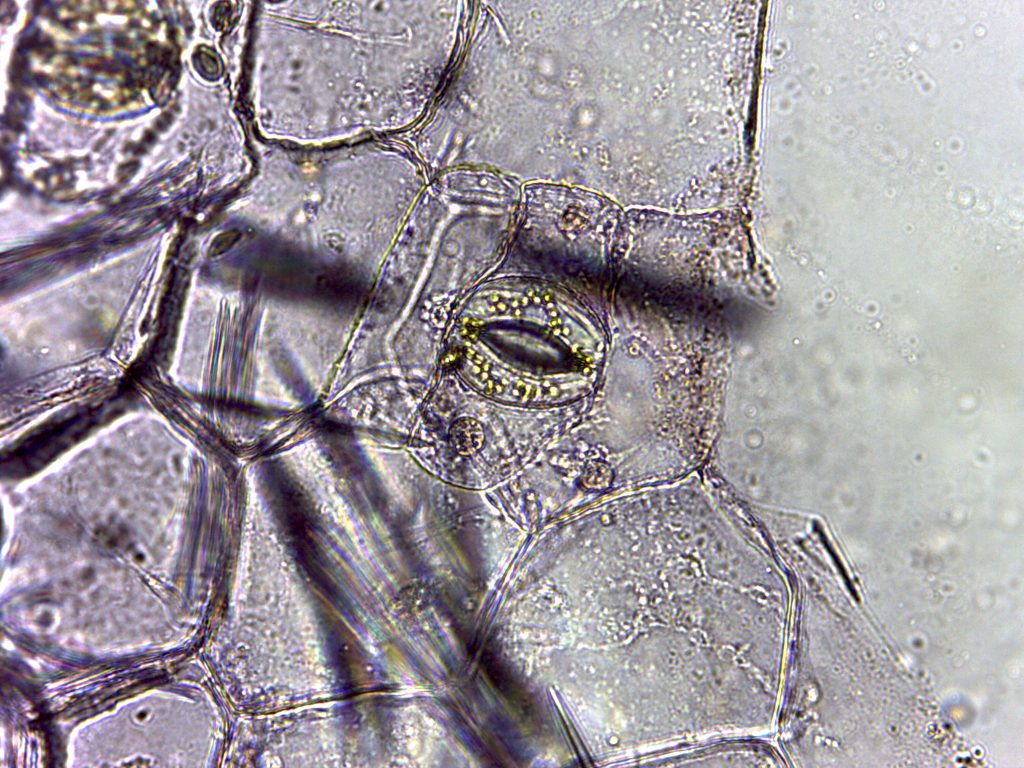
Stomata from BIO 183 student prepped Zebrina epidermal whole mount and leaf peels (A, B, and C)


Computer animation as you travel into a leaf, plant cells, and into a chloroplast. What types of cells can you see inside the leaf? Once in a cell, what organelles do you see? Once in the chloroplast, what structures can you see? What rotating molecules are embedded in the surface of the grana? Where else have we seen this special molecule?
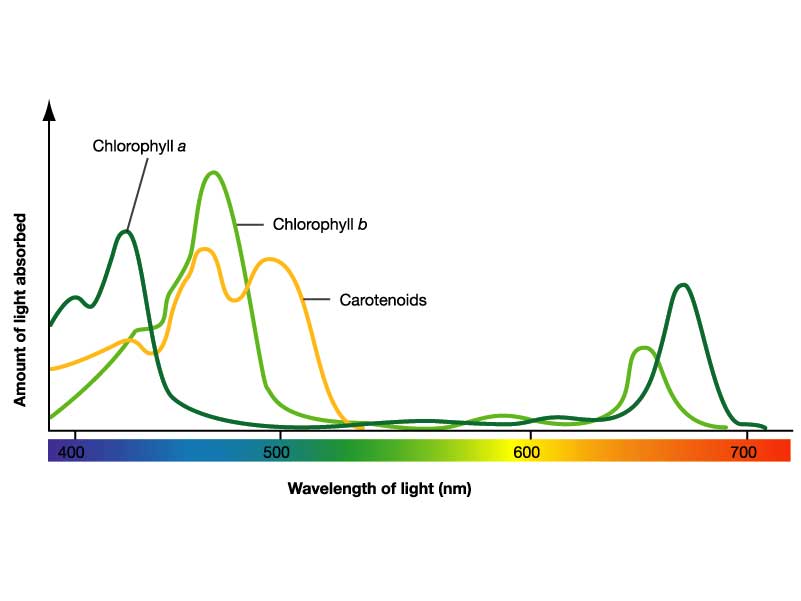
Visible Wavelengths of Light and Absorbance Spectra of PS Pigments
Activity 1: Paper Chromatography
Plant Pigment Chromatography – review your lab handout/lab manual for the key concepts of the procedure that produced the following images.
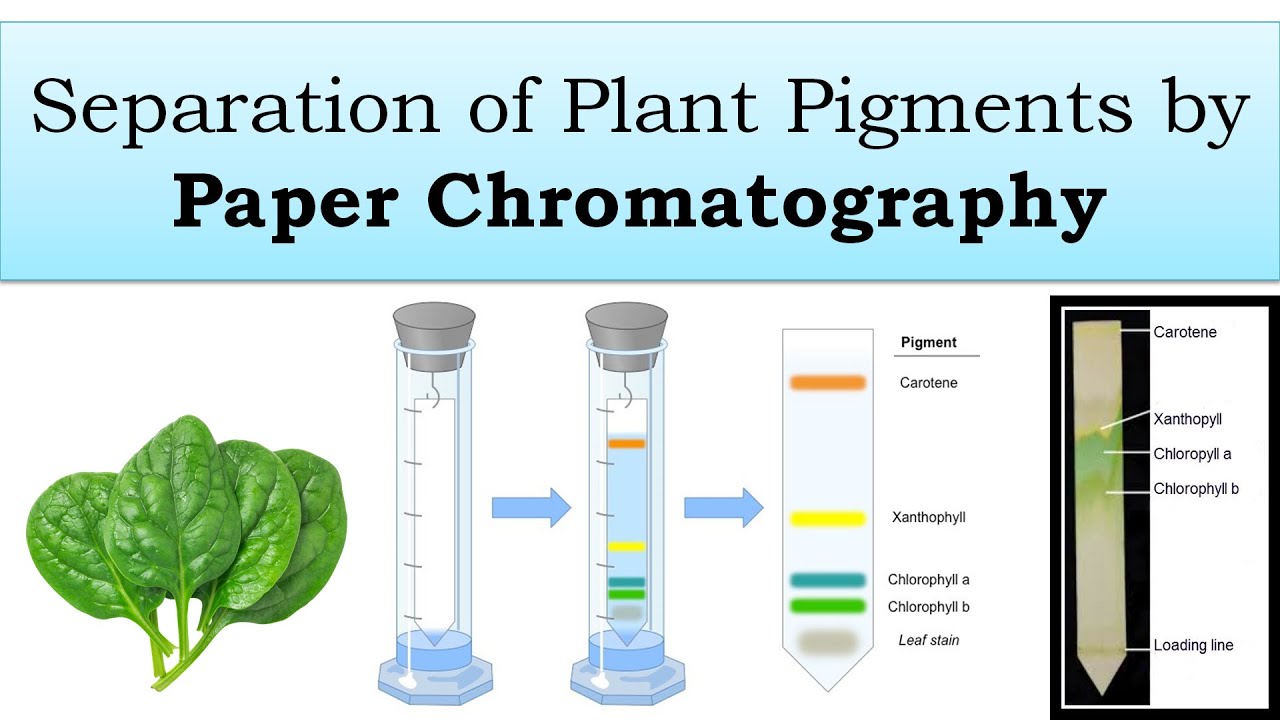
Photosynthetic Pigments in Spinach – separation by a similar technique that we used with magnolia leaves.
A.  . B.
. B. 
A. A coin is used to crush the Magnolia leaf and embed the chromatography paper with leaf tissue. B. The chromatogram placed into a chamber with a 9:1 Ether Acetone solvent. Within 5-10 minutes you should start to see 4 distinct photosynthetic pigments separating as the solvent is absorbed up the paper.
Once your own chromatogram has be completed and dried, can you tell which pigment is the primary pigment, chlorophyll a? Which are the accessory pigments chlorophyll b, xanthophyll and beta-carotene? What is the bottom brownish line composed of? Sketch and name all of these colored compounds in your lab handout.
C.  .
.
Above (C) is a completed chromatogram as seen under UV light. The lower green pigment above the origin line seems to be glowing a red color (it is fluorescing!). What does this infer about the green pigment, light energy, and the pathway of the photosynthetic reactions?
Light Reactions of Photosynthesis – a nice animation explaining how ATP and NADPH are produced.
Activity 2: Light Reaction Measurements – Background information:
A new Animation of Light Reactions –more in depth than above or needed for lab, but may be helpful for lecture.
Light Reactions Diagram below

We will study the light reactions of photosynthesis by using an artificial electron acceptor (DPIP) with isolated spinach chloroplasts and a source of light. As electrons move along in the Light Reactions of Photosynthesis, DPIP can be used to capture electrons. DPIP is dark blue, but will become more clear as it accept/intercepts electrons moving along in the Light Reactions. By measuring the change in color (from blue to more clear) we can quantify the rate of the Light Reactions of photosynthesis. We will use a spectrophotometer to monitor this reaction by monitoring the Transmittance of light passing through the DPIP/chloroplast solution. This experiment is referred to as the Hill Reaction.
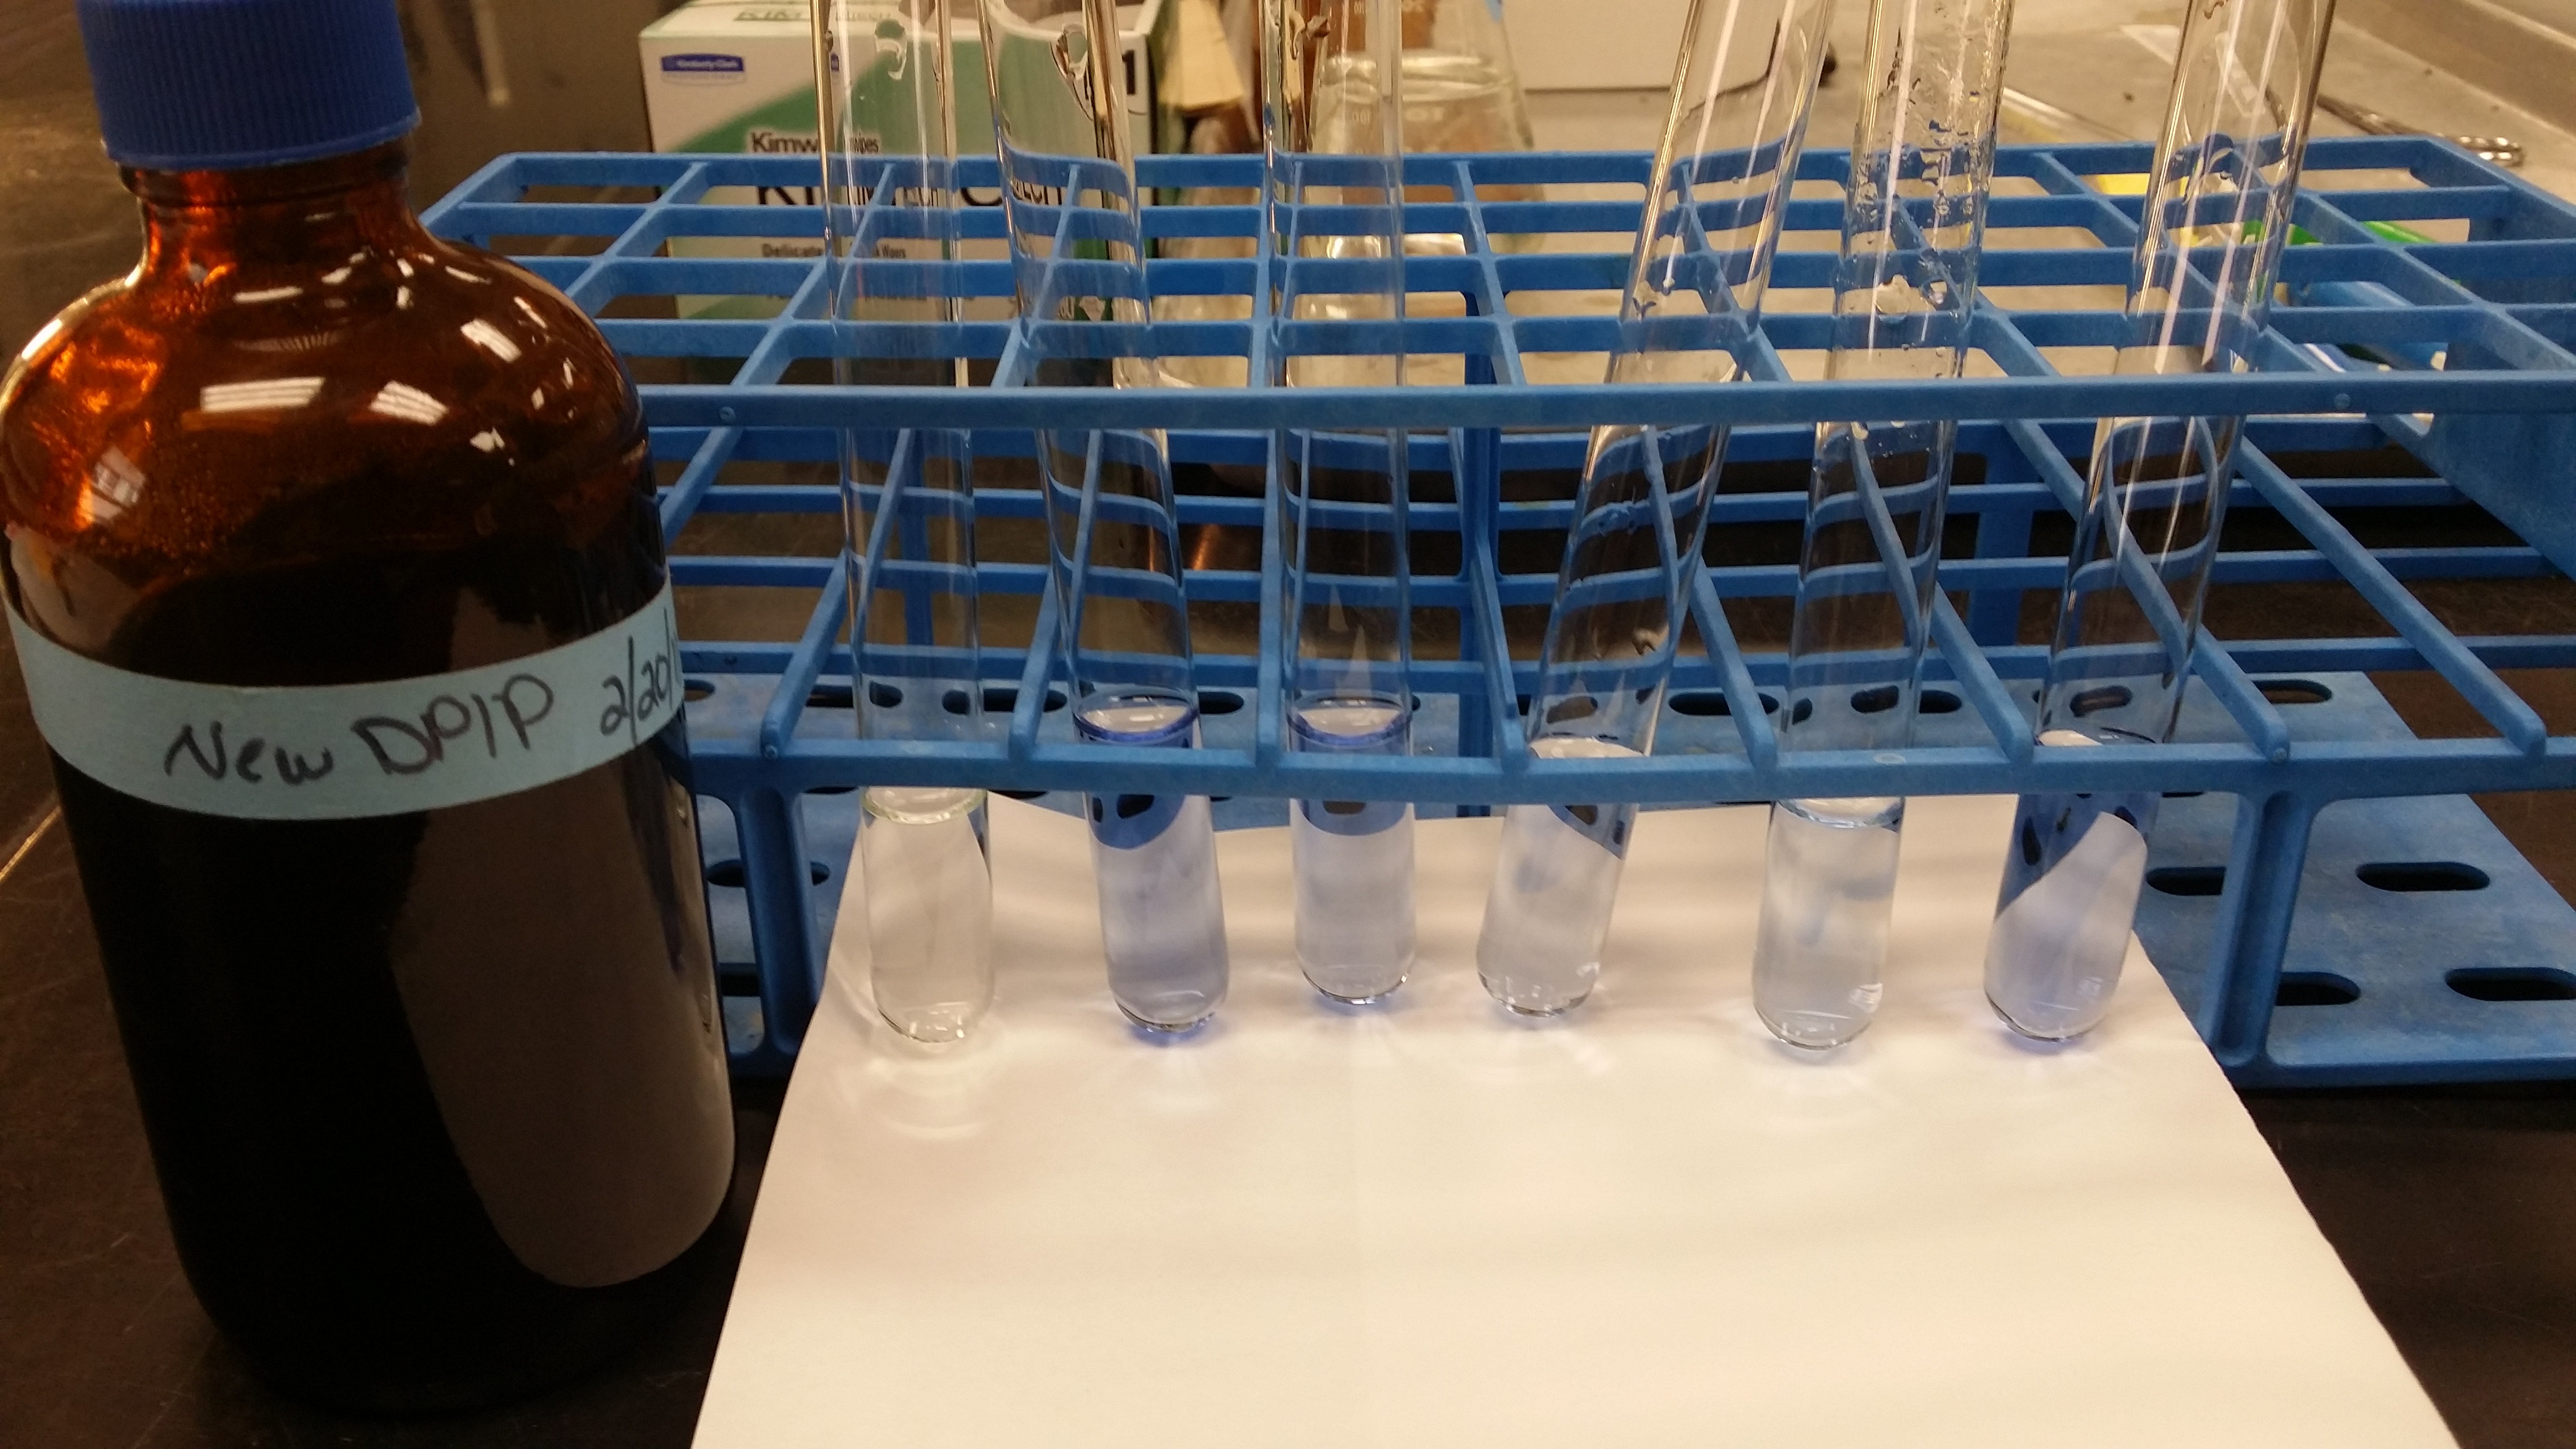
Note the difference in blue color in these test tubes. The tube closest to the brown DPIP bottle is the blank (no DPIP added). The more that light reactions of photosynthesis occur, the lighter or more clear the test tubes with DPIP and thylakoids will become. The darker tubes show less reaction.
Follow the directions in Activity 2 in your lab handout and answer the questions in the lab handout.
Reminders about the Spectrophotometers we used in the Enzyme lab:
How Spectrophotometers Work – this week we will measure Transmittance, not Absorbance as measured in the Enzyme lab.
How to use a Genesys 10 Spectrophotometer (4:43) -same video as on the Enzyme Lab webpage.
Remember – your BLANK is very important. It contains all the components of the experiment except for the color indicator that will change color as the reaction proceeds. The BLANK is used to set up your Spec to monitor the changes in color that occur in your sample tube. By pressing “Measure Blank” with your Blank in the appropriate space, the machine will zero itself to not “measure” those components. When you change to a treatment cuvette the Blank component measurement is automatically subtracted out and only the change from the reaction seen in DPIP will be measured. Watch the above video if you are still unclear about how to use a Spec and purpose of using a Blank.
List of Possible Light Treatments for our Photosynthetic Experiments
Below are some provided pictures of the set-up for some of the available treatments. Your group will need design 2 additional treatments to explore the Hill Reaction beyond white light treatment.
A.  B.
B.  C.
C.  D.
D. 
E.  . F.
. F. 
A. The above pictures show the set up of a cuvette at a set distance from a lamp shining white light. The fishbowl acts as a heat sink between the lamp and the cuvette. B. The cuvette going into the Genesys spectrophotometer to measure Transmittance every 30 seconds. The last 4 pictures, (C-E) show the use of colored films to alter the wavelengths of light reaching the sample and (F) an assortment of different light bulbs to use (see this list for bulb specifics).
Photosynthesis Graphing Activity: Construct ONE graph containing all of your data:
- You should also include a copy of all your data and your graph in your lab handout.
- Include a trendline for each sample and add the slope equation for each of the trendlines on your ONE graph.
- Be sure to include all 5 key components of a proper graph (see the Resources page Appendix D if you are unsure of this).
Completed Photosynthesis Lab Unit 3 Lab Handout (all pages) due in Moodle 24 hours after lab
Be sure to answer all questions found throughout the labs and the end, and insert your completed Enzyme graph with all data on one graph. The graph should include a trendline and line equations for each of the baseline and treatments data. Any images in your Word Document should be saved as JGPs. HEIF iPhone images may appear blank in Moodle for your TA (so can’t be graded). This is an Individual Assignment.
Cell Respiration Assignment
This is due by Friday 11:59PM during the Off Week after your Photosynthesis Lab Week.
Click this box to view and download the Cell Respiration assignment. Meet and work on this assignment as a group. Submit 1 assignment per group.
Group Work Peer Evaluation form – each should should complete their own peer review and submit it on Moodle by the same due date as the Cell Respiration Assignment.
Reminder – First Full draft of the Pathogen Project Paper is due by the start of your DNA Fingerprinting lab.
For guidence, click to access the Pathogen Project Webpage and Scroll down towards the bottom of webpage
Group Work Peer Evaluation form – each should should complete their own peer review and submit it on Moodle by the same due date as the Project Full First Draft.
The Calvin Cycle (light independent reactions) – a nice animation overviewing these reactions, though not a main focus of our lab.
Cool Article on Biohybrid Light Antennas – Altering natural light harvesting antennae (pigments) to maximize the range of useable light in photosynthesis. Working towards increasing solar energy capture systems.
The Biochemistry of Fall Foliage – plants saving/reclaiming resources
Fall Foliage in NC: What to Expect this Year (2025) – NCSU College of Natural Resources
A New Way to Genetically Tweak Photosynthesis Boosts Plant Growth – Further explanation of the metabolic pathways involved can be found in the primary reference article of this research.