Properties of Enzymes – In Person Lab – not final yet
Scroll below for In-person Labs
Enzyme Lab Handout (In-Person labs)
You will need to use Excel or Google Sheets to graph your data. As an NCSU student, you can download Microsoft Office 365 from NC State’s OIT software site for free!
While working along in these Enzyme Experiments, you will want to keep in mind the components of the Scientific Method and good experimental design. This will also serve you well in the 2 assignments that you will work on next week while you are not in lab (Off Lab week).
Identify the following experimental design terms as you work through the Enzyme Lab experiments this week at your table and/or throughout the lab room.
- Control and Experimental Group(s)
- Independent – what you manipilate or change in the experiment.
- Dependent – what is changed by the experiment, often what is measured.
- Controlled Variables – experimental components that are kept the same.
- Replication
Read along in your Enzyme Handout as you work with the information in this webpage. Fill in and answer questions accordingly. Your Enzyme Handout will be collected for grading 24 hours after the end of your lab class.


How Cells Work – Enzymes
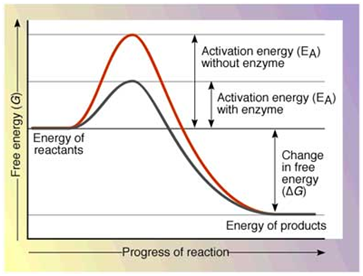
Chemical Reactions and Activation Energy
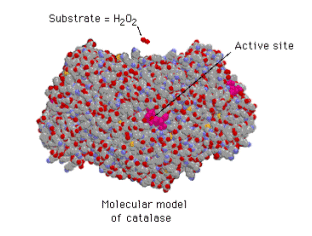
Catalase
Animation – Enzyme Function and the difference between competitive and non-competitive inhibitors. (everyone should watch this, esp. Group 2/Table 2 students)
Activity 1: Qualitative Study of Catalase
2H2O2 + catalase —-> 2H2O + O2 + catalase
Catalase is prepared by blending a potato in cold water, then filtered by straining the mixture through 4 layers of cheesecloth. The catalase solution is then kept cold on ice. Why would filtering and maintaining a cold temperature be important for the catalase solution?

Procedure A: Testing the Activity of Catalase
Follow steps 1-3 and complete Table 1 using the results from your 4 prepared test tubes. The picture below shows the appearance of catalase and boiled catalase used Procedure A. What would account for the difference in appearance of the boiled catalase? Where did the “chunks” come from?
 .
.
Procedure B: Testing the Activity of Catalase Under Six Different Environmental Conditions
You will be assigned to work with ONE of the six environmental conditions (Groups) below. Propose a plausible hypothesis for your assigned experiment. The same basic reaction as tube #3 in Procedure A is followed, but treated with an assigned environmental condition. Answer all questions and fill in the Table that corresponds to your assigned treatment in your lab manual (Tables 2 – 7).
Group Assignments for Procedure B:
| Group I: Effect of Substrate Concentration on Catalase* | Group II: Effect of Hydroxylamine and Subs. Concentration* |
| Group III: Effect of Salt Concentration on Catalase | Group IV: Effect of the Metal Copper Sulfate |
| Group V: Effects of pH on Catalase | Group VI: Effect of Temperature |
- * To make substrate concentration dilutions for Procedure B Groups I & II:
- 1.5% H2O2 = 5 ml 3% H2O2 + 5 ml H2O
- 0.75% H2O2 = 5 ml 1.5 % H2O2 + 5 ml H2O
Activity 2: Quantitative Study of Catalase
2H2O2 + catalase + guaiacol (colorless) —-> 2H2O + catalase + tetraguaiacol (orange-brown)
We can study the same reaction as above in a more detailed manner by fine tuning the experiment. Instead of learning about the relative activity of catalase, observing more or less reaction, we can introduce a sensitive color indicator to detect the presence of one of the reaction products. The color indicator guaiacol will change from clear to orange-brown as it binds to the O2 produced in this reaction forming tetraguaiacol. This color change can be measured using a spectrophotometer. These data can then be graphed and rates determined for the baseline reaction of catalase, but also for the various treatments.
Procedure C: Using a Spectrophotometer to Monitor Baseline Catalase Activity


Carefully read the Procedure C background. This will help you fill in and answer Procedure C questions and Table 8 & 9 in within in your lab handout. We will use Genesys spectrophotometers and square disposable cuvettes. If you have not used a spectrophotometer before, view the videos below. It is very important to use an appropriate blank for each treatment that is run. The blank will contain all the same components as the treatment tube, minus the enzyme. This way we will know that any change in color is resulting from the activity of the enzyme itself.
Is the Blank tube a control in the experiment? What is its purpose?
How spectrophotometers work – transmittance and absorbance
How to use a Genesys 10 Spectrophotometer
Determining Baseline data – Follow directions in Procedure C to collect quantitative data. Then create a graph monitoring the baseline catalase reaction. Be sure to label the graph correctly with all appropriate graphing components outlined by your TA and indicated in the Resources links below.
- Add a trendline and the equation of the trendline to your graph.
Graphing Resources:
Graphing with Excel – Appendix D listed on the Resources page (Appendix Resources for BIO 181 and 183). This lists the 5 key criteria for a proper graph (p. 204) and also shows how to add a trendline and equation for the best fit line (p. 203). These graph additions are both important skills needed for the Enzyme lab assignment and later lab units and assignments in BIO 183.
Reminder — NCSU Student can download Microsoft Office 365 from NC State’s OIT software site) for free.
Understanding and Representing Data – Appendix E listed on the Resources page (Appendix Resources for BIO 181 and 183).
Procedure D: Using a Spectrophotometer to Monitor the Activity of Catalase Under Different Environmental Factors.
Since you have already learned about the relative effect of ONE environmental condition on catalase, you will next further explore and quantify the same condition you already studied in Procedure B in Procedure D.
- Groups should write their hypothesis about the effect of their assigned treatment on catalase activity.
- Design their own procedure to quantify their assigned treatment by carrying out 3-4 different additional trial runs.
- Be sure to refer to Hints at the end of Procedure D in your lab handout. (very helpful!)
- While the same basic procedure may be followed, what is needed for the blank tube used in the spectrophotometer? Would the blank be the same as Procedure C? Or does it need to change? Why or why not?
Completed Enzyme Lab Unit 2 Lab Handout (all pages) due in Moodle 24 hours after lab
Be sure to answer all questions found throughout the labs and the end, and insert your completed Enzyme graph with all group data on one graph. The graph should include a trendline and line equations for each of the baseline and treatments data.
Any images in your Word Document should be saved as JGPs. HEIF iPhone images may appear blank in Moodle for your TA (so can’t be graded).
Off Lab Week after the Enzyme Lab
During the off week that follows your Enzymes lab, you will be asked to work on 2 separate assignments. The first assignment (on which you should work individually) is the Experimental Design Assignment. This worksheet will familiarize you with some of the basic requirements of experimental design. This will prepare you to work as a group for the second assignment (Proposed Experiment to Test Enzyme Function). Your answers to both should be written in your own words (not copied or AI generated). Both documents should be submitted on Moodle by Friday 11:59PM of your off week (See due date on Moodle and linked to your Group # 1 or 2 on the Fall 2026 Lab Schedule).
Experimental Design Assignment – Individual
This assignment is worth 10 points. You can type your answers in a document separate from the many pages of the assignment. Be sure to clearly number each answer. This is due by Friday 11:59PM during the Off Week after your Enzyme Lab Week.
Click this box to view and download the assignment.
PDF Version of the above Take Home Experimental Design Assignment in case you cannot see the graphics.
Complete the Experimental Design Assignment above on your own before working as a group on the Enzyme Assignment below.
Since you have already learned about the relative effect of ONE environmental condition on catalase, you will next further explore catalase using the in lab quantitative method (Procedures C & D) under a different condition than what your group already studied in Procedure B.
Catalase- Designing Further Experiments – Group Work
This assignment will help you combine the key components of the Experimental Design Assignment above, and the knowledge gained from lab to further our studies of the properties of Catalase. This is due by Friday 11:59PM during the Off Week after your Enzyme Lab Week.
Click this box to view and download the assignment.
Group Work Peer Evaluation form(opens in new window) – each should should complete their own peer review and submit it on Moodle by the same due date as the Catalase Designing Experiment Assignment above.
Preliminary Pathogen Paper Outline
Each group should do all work and have a preliminary outline of their entire paper in each group project Google folder by the start of your Photosynthesis lab. This outline should build upon your proposal with added text and research from each group member.
Use the Writing a Scientific Review Article provided on the linked Pathogen Group Projects webpage.