Ecology Week II: Modified Urban Ecology Lab – In Person
This week the In-Person Lab and Make Up Module are the same. If you miss lab, contact your TA ASAP to discuss how to receive additional data to incorporate with your own data to complete the In-Lab and Post-Lab work on your own.
Importance of completing the Pre-Lab
- Students will need to go outside and collect their own data to bring to lab this week. It is important to do the Pre-Lab so that you have your own data to combine with your group members during the In-Lab class period.
- Read the Following information in your Lab Manual and on the website below to guide you in doing the Pre-Lab.
- Submit your completed Data Collection Handout – Urban Ecology for Pre-Lab assignment on Moodle before the start of class.
Before going out in the field to collect data:
- Read the Learning Objectives and Background information in your lab manual on pages 55-56. Then review the basic Sampling Methods for sampling and data collection on pages 57-58 #1-3. This will provide a basic understanding of what you will do out in the field. There are some modifications from what is in the lab manual and what you will do explained in the website for this Unit.
- Visit and complete the Urban Ecology Pre-Lab webpage to see expanded directions for data collection.
- (Print copy of Methods if needed for offline work)
- Bring your own completed Data Collection Handout – Urban Ecology from the lab website (this is different from what is in the lab manual). Each student should sample their own 2 trees. Observe your tree for 20 minutes to observe any wildlife that may visit your tree (birds, insects, mammals…) and record that information too.
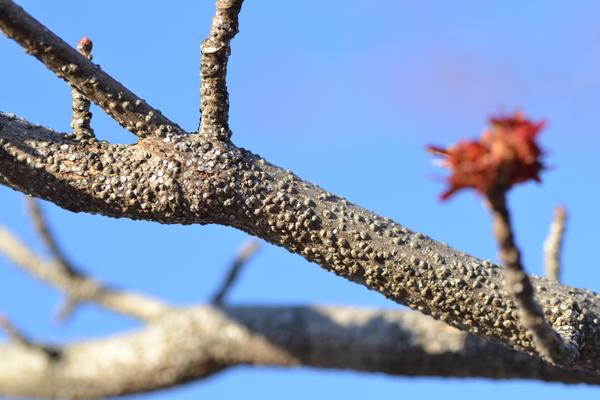
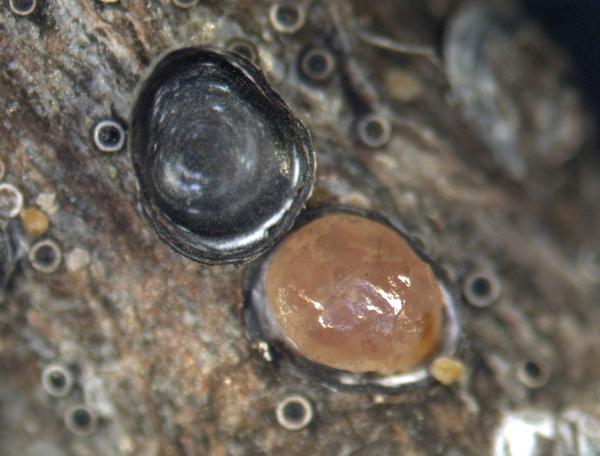
- Images of leaf herbivory, fungal infection and other tree associations (from lab last week) may be helpful as evidence for the presence of various herbivores.
- 13 Steps for evaluating tree health – use this link to help rate the health of your tree as you collect data.
- Read this short article on Dying Trees in Cities?
- See the Additional Resources at the bottom of this webpage for additional help with the topic and tree/organism identification.
- Review the Field Work Safety Guidelines(opens in new window) and plan accordingly.
- Be ready to access Excel or Google Sheets (you can download Microsoft Office 365 from NC State’s OIT software site)
Interpreting Data collected by BIO 181 lab students in Spring 2019 (Lab Manual p. 55-61)
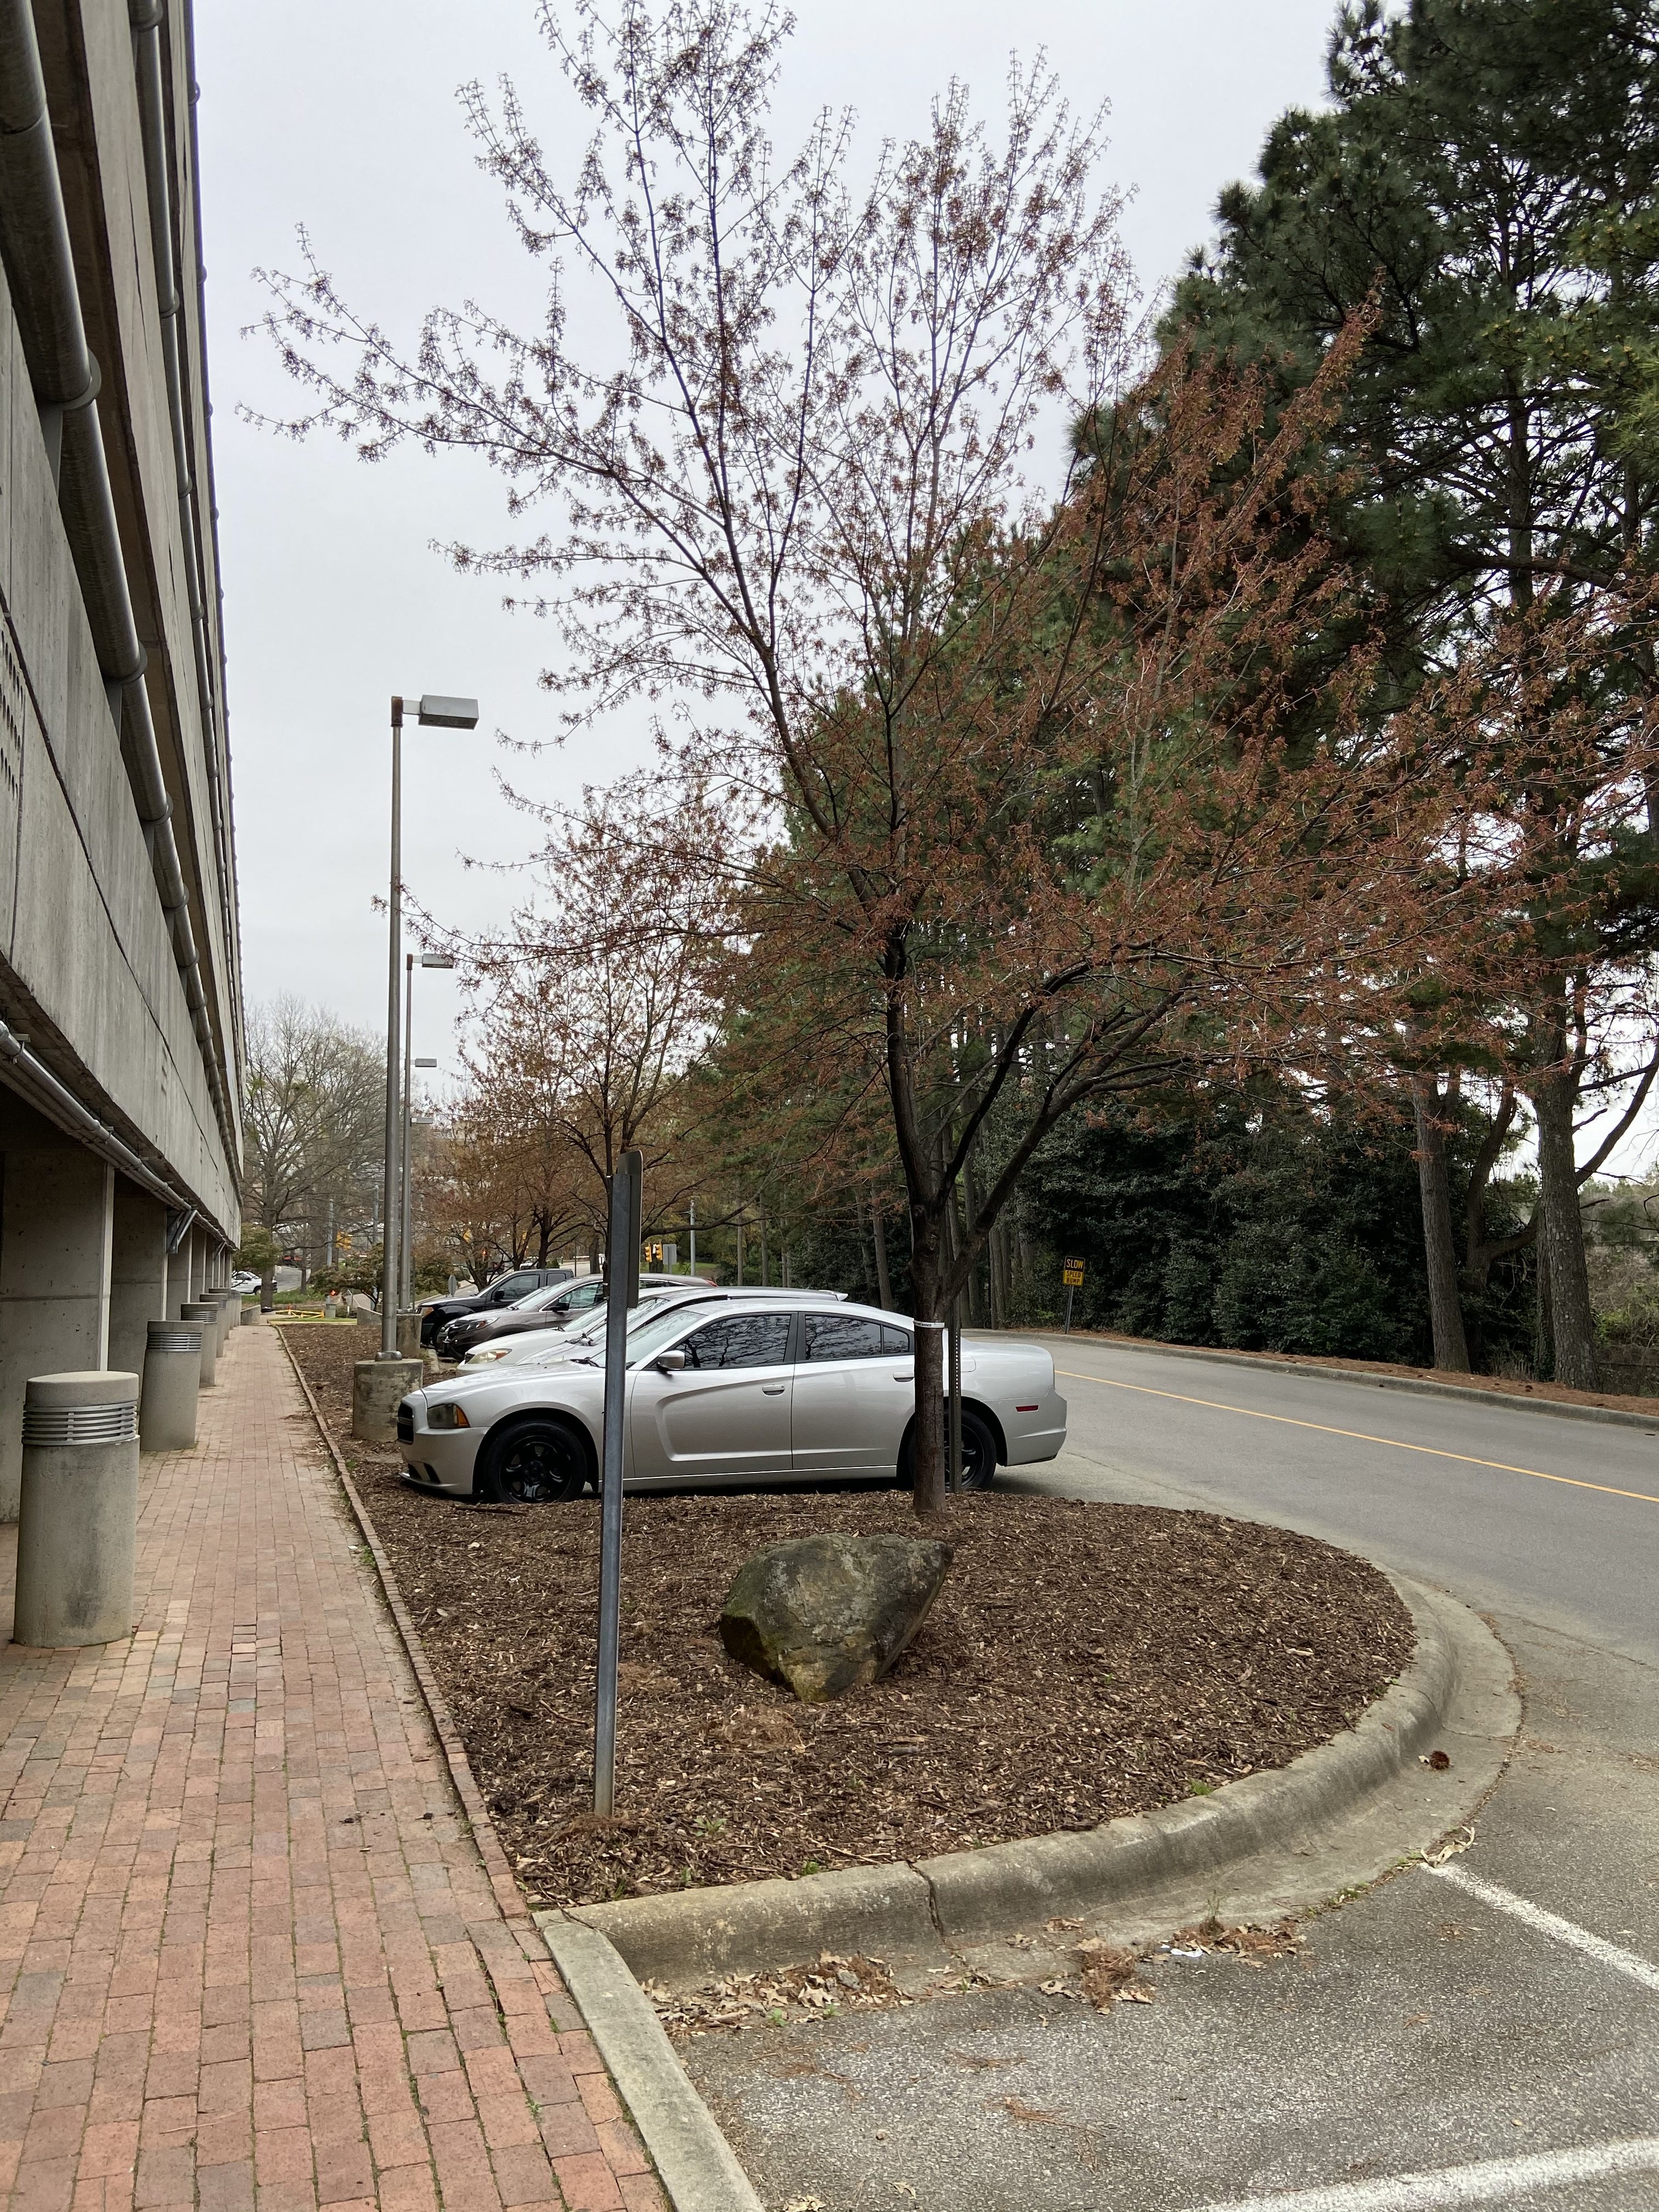
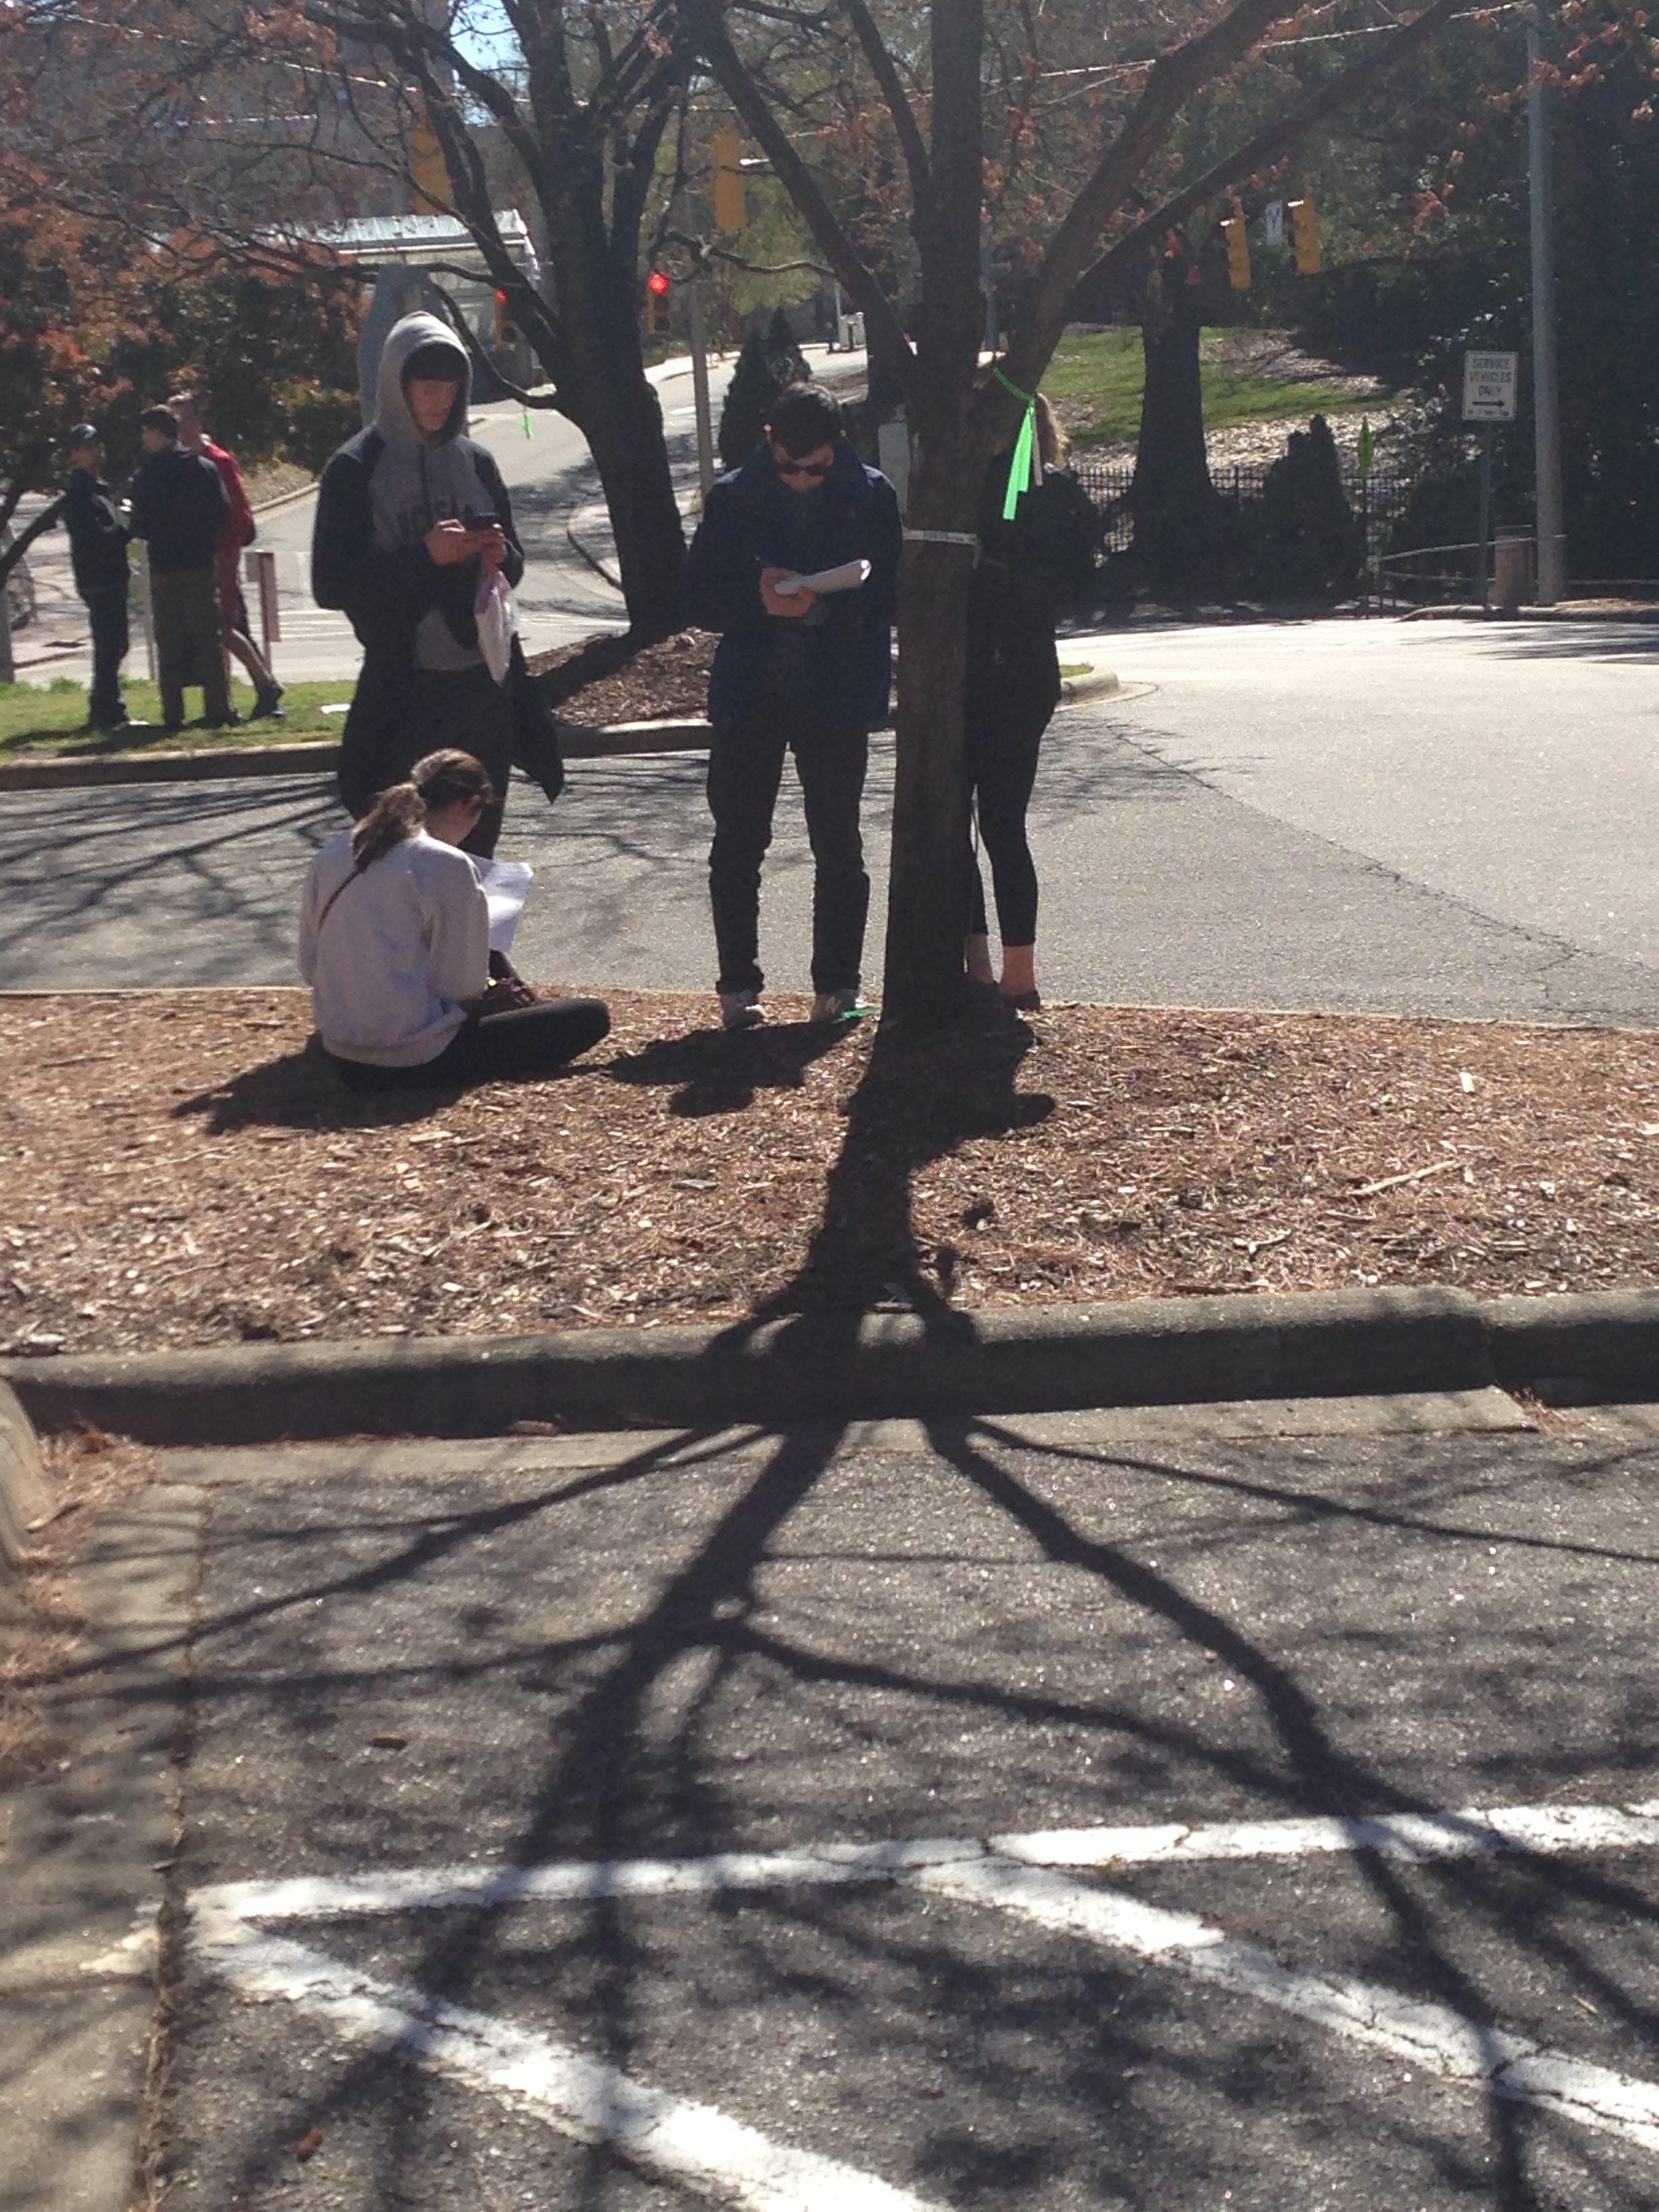
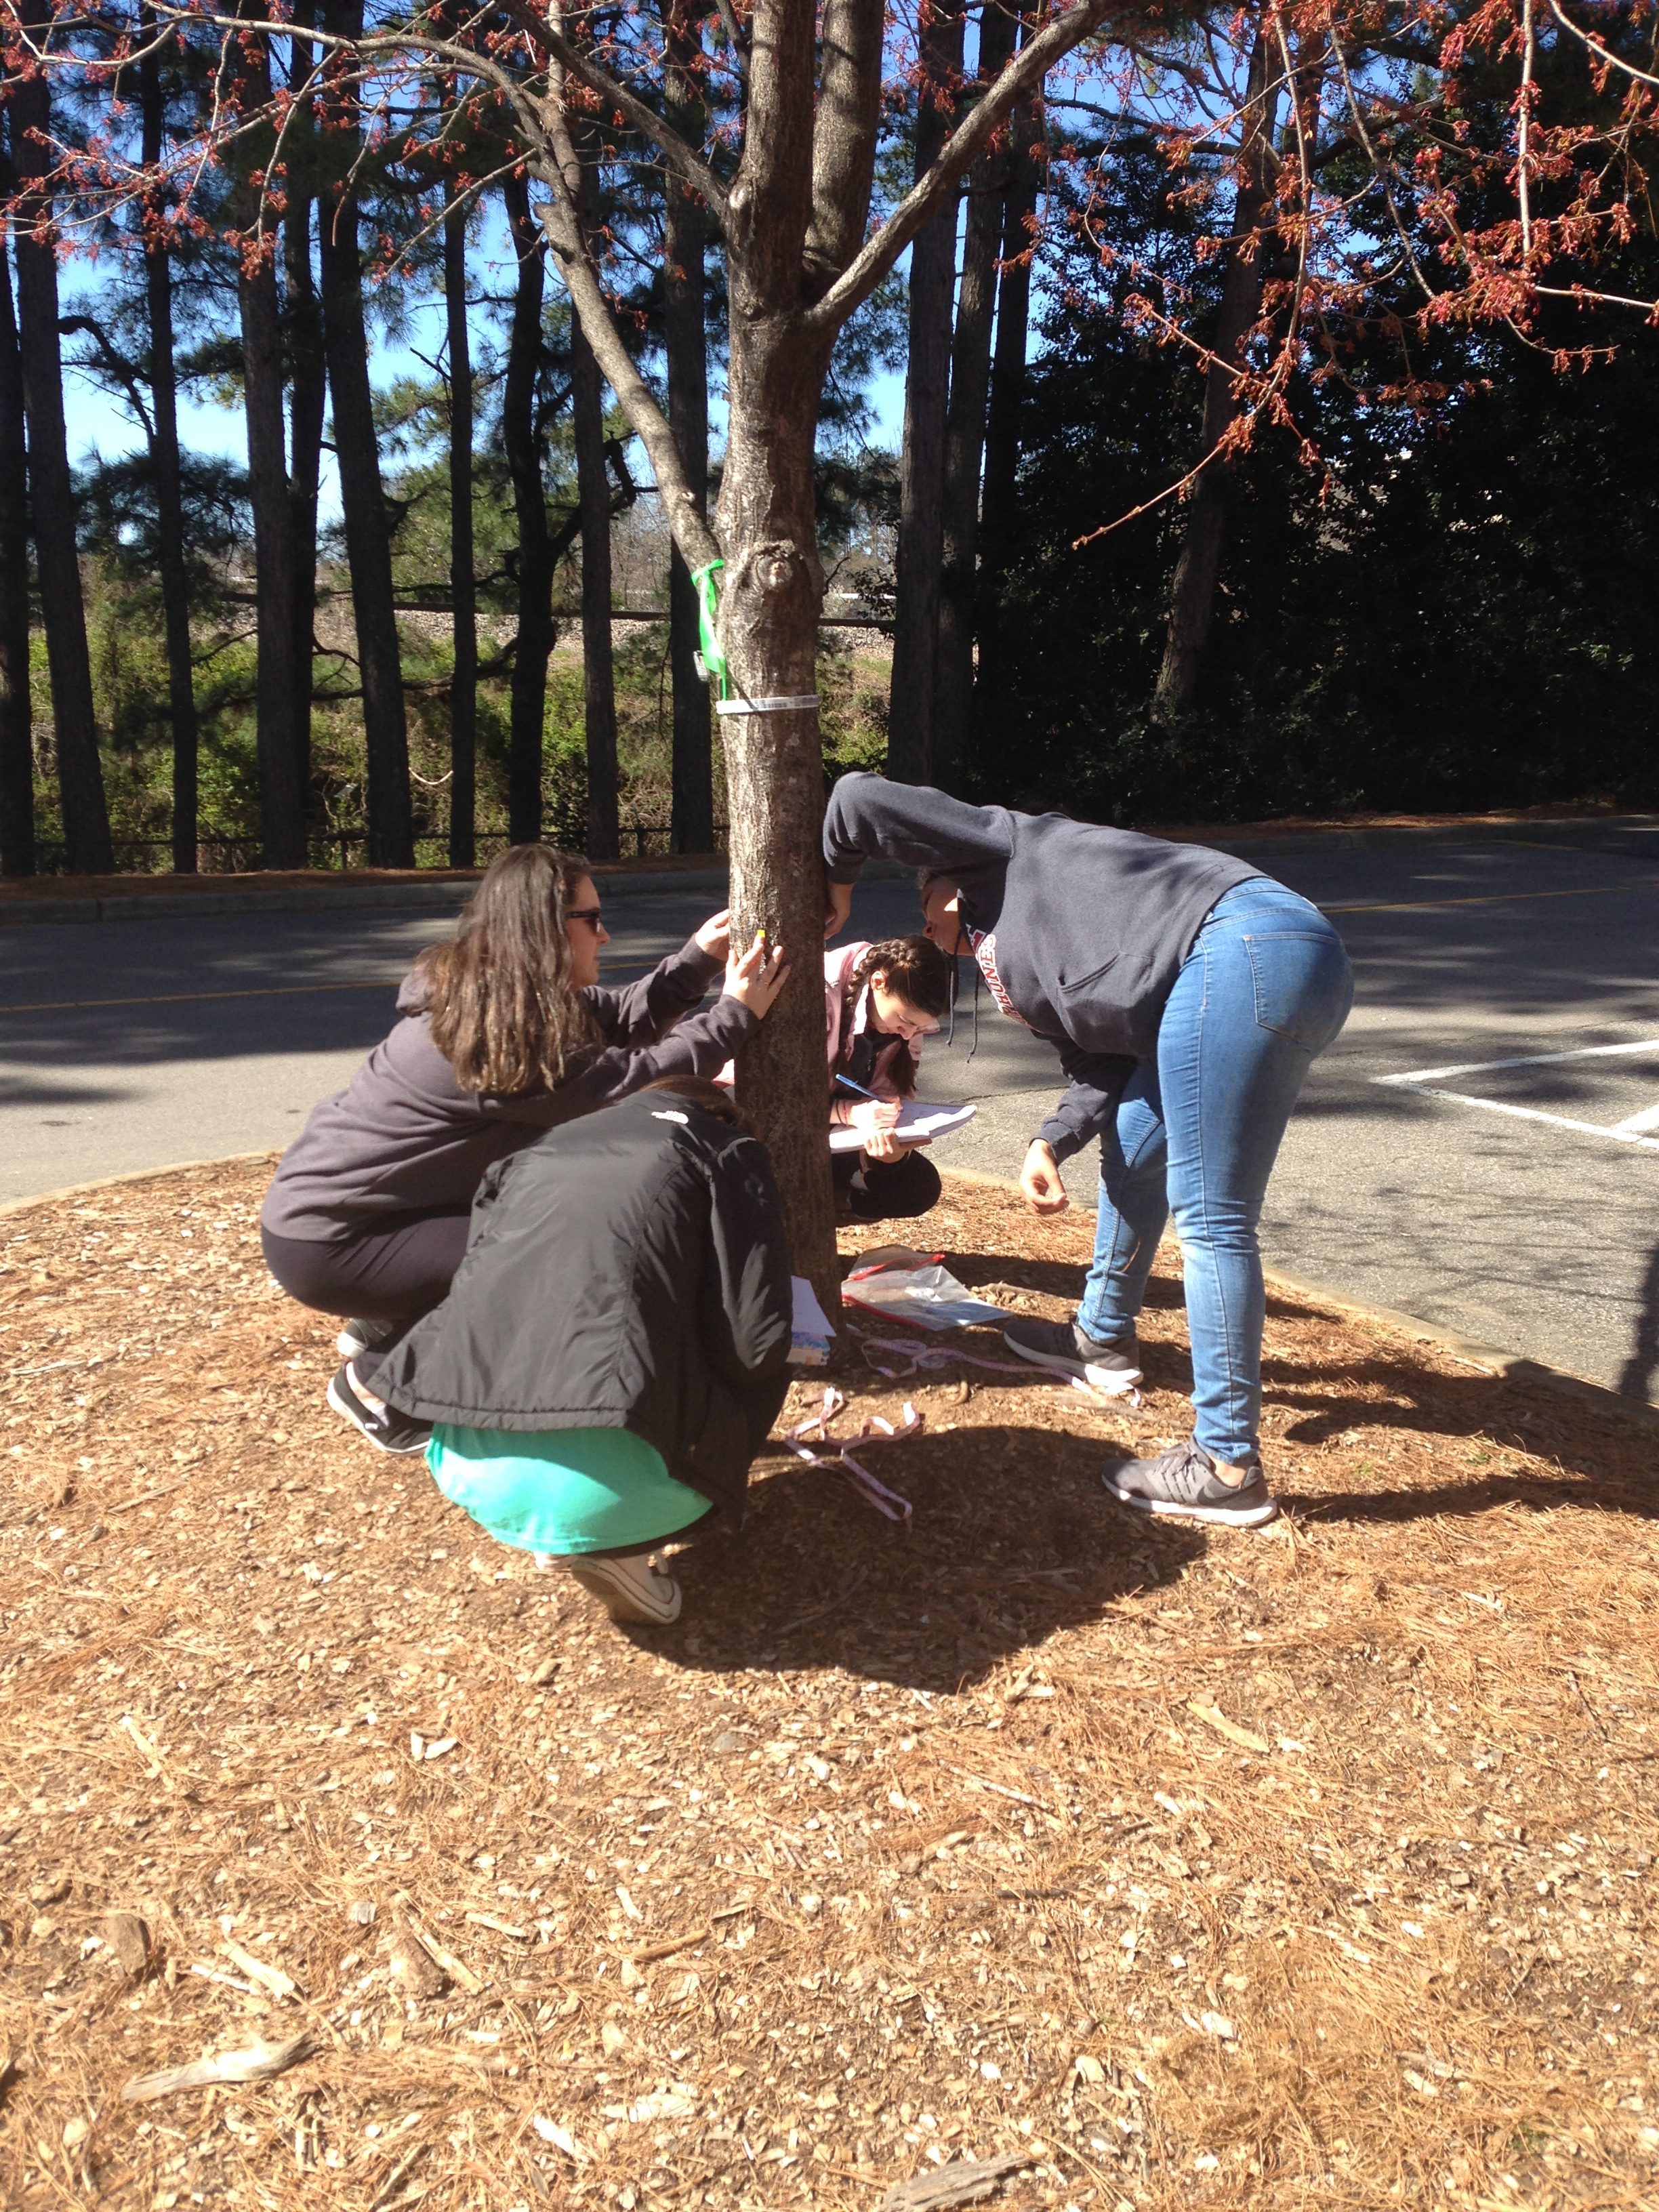
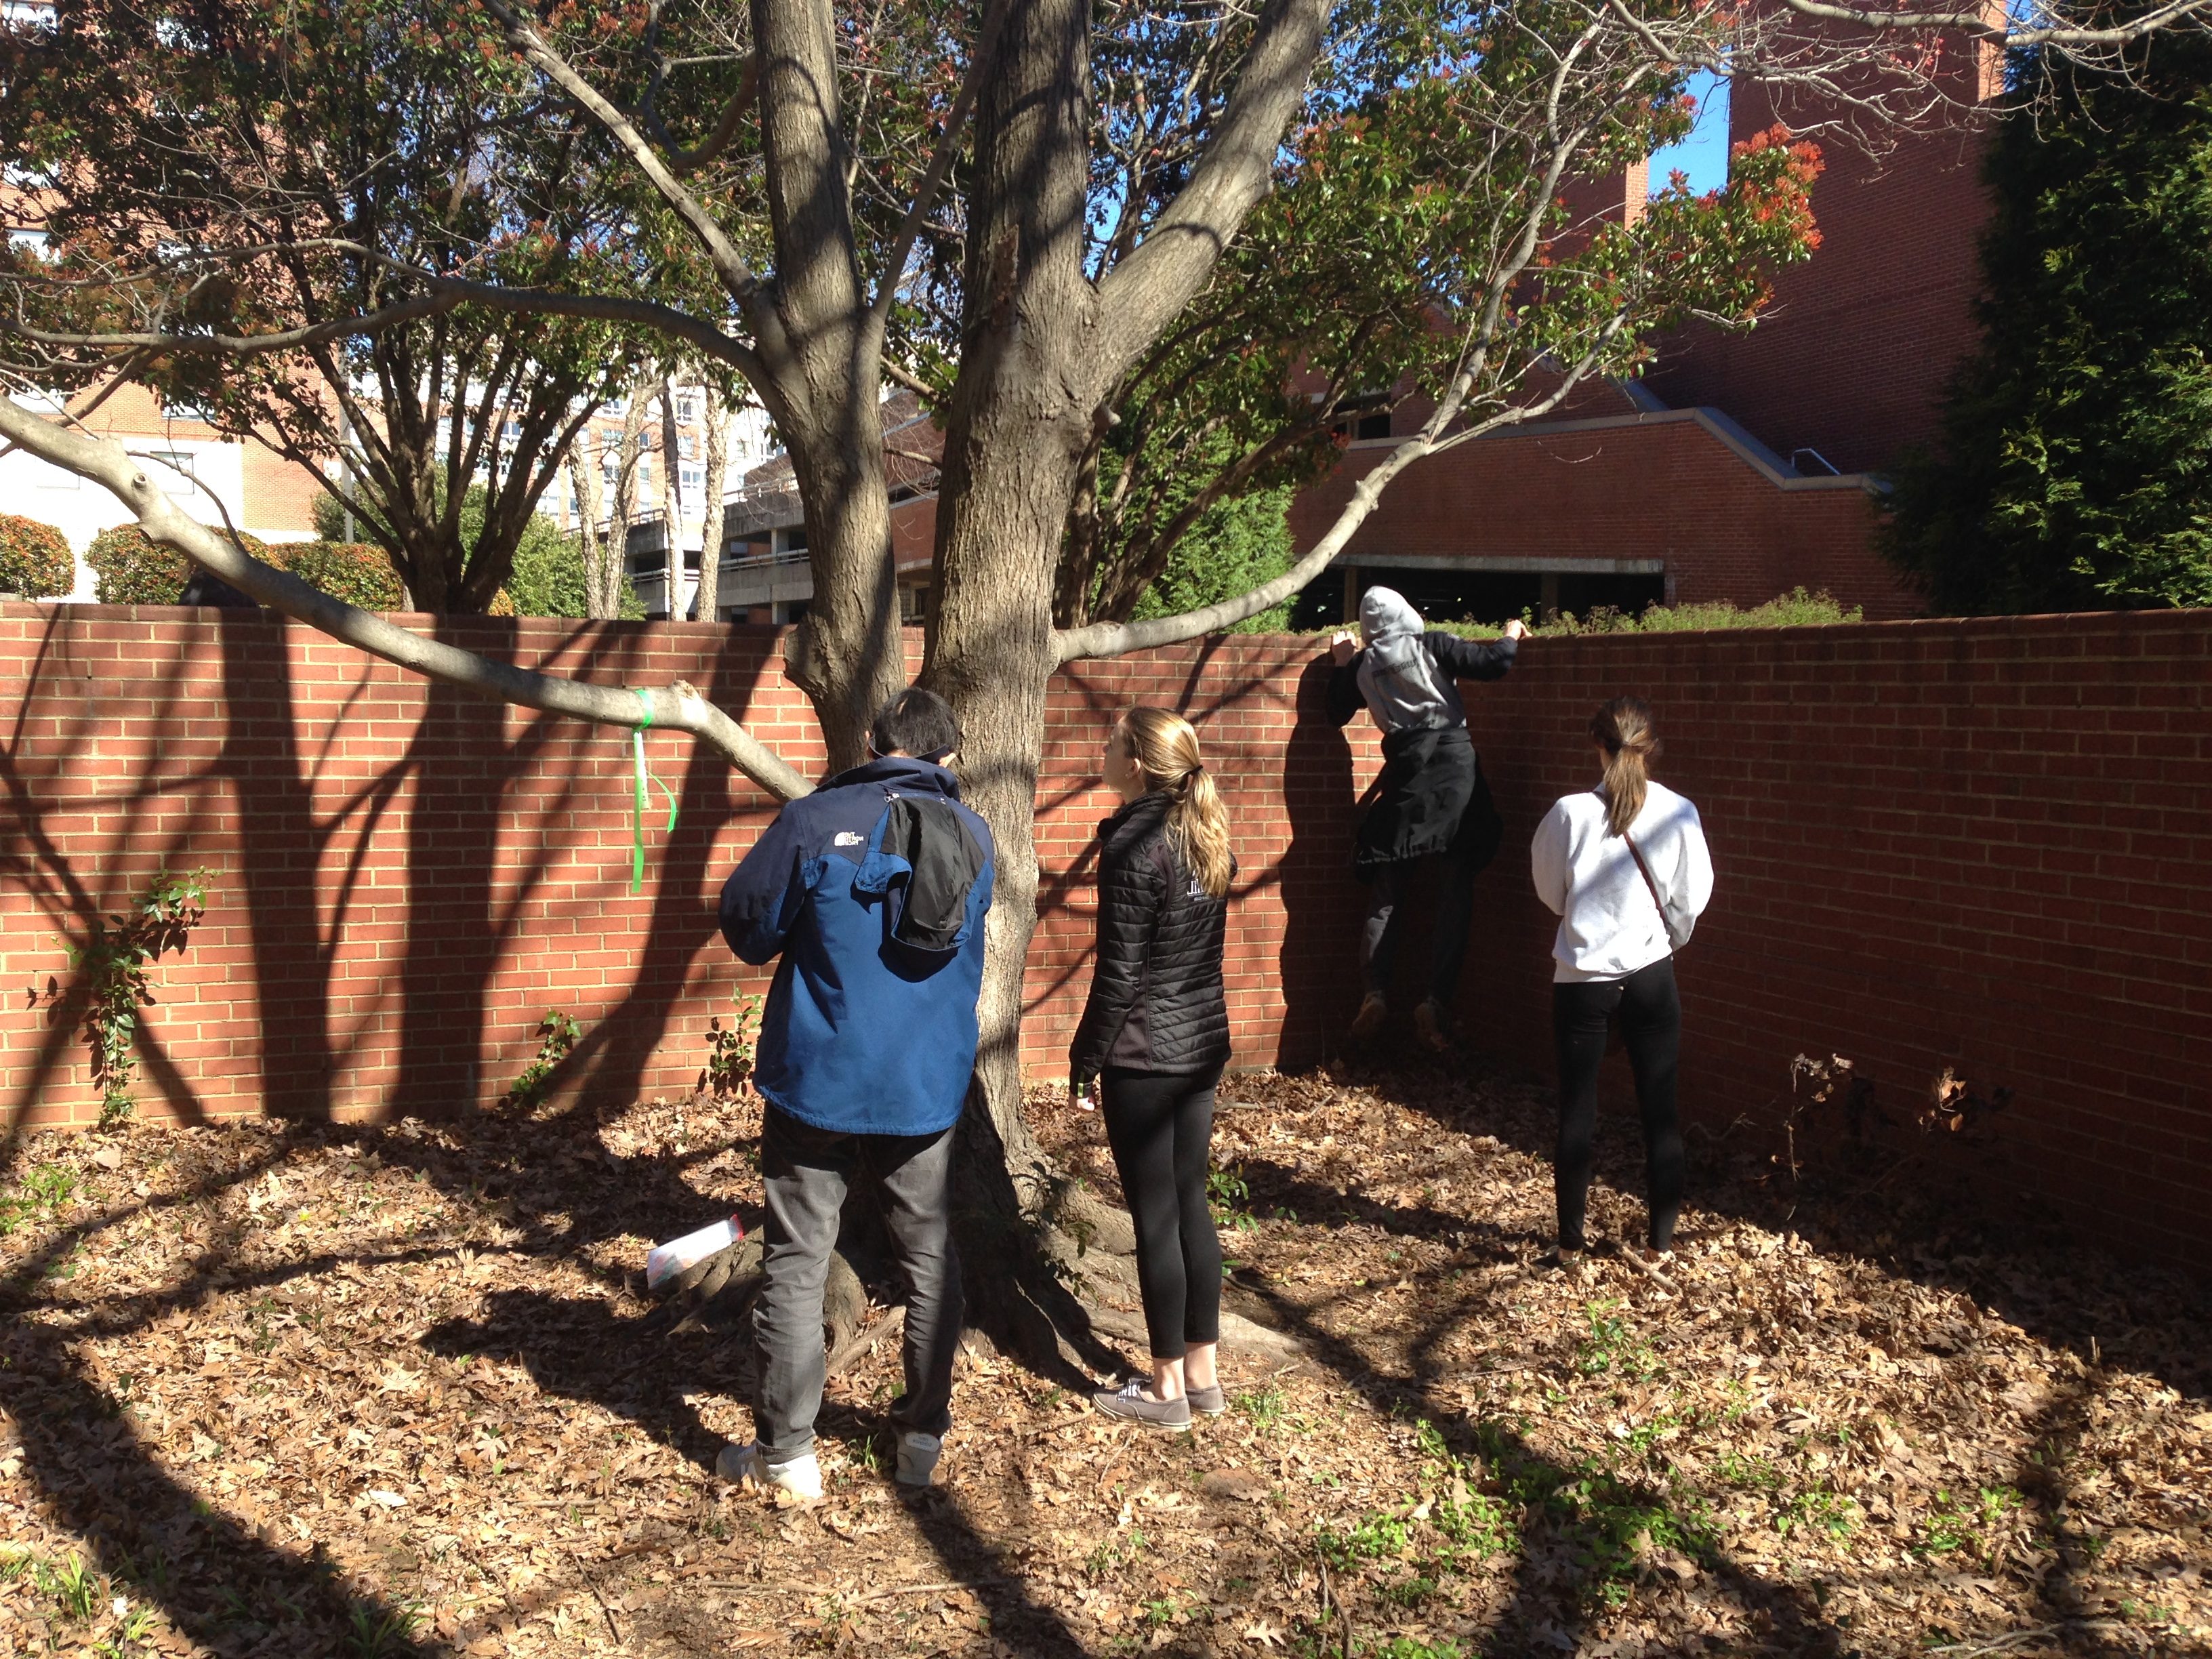
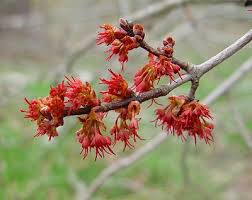
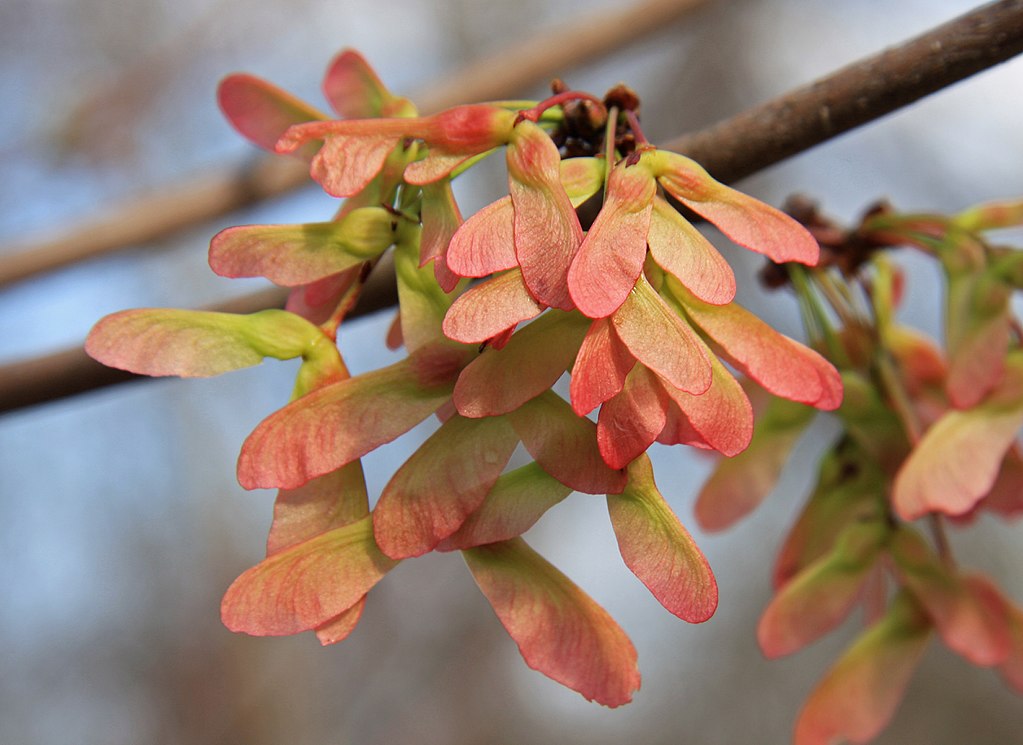
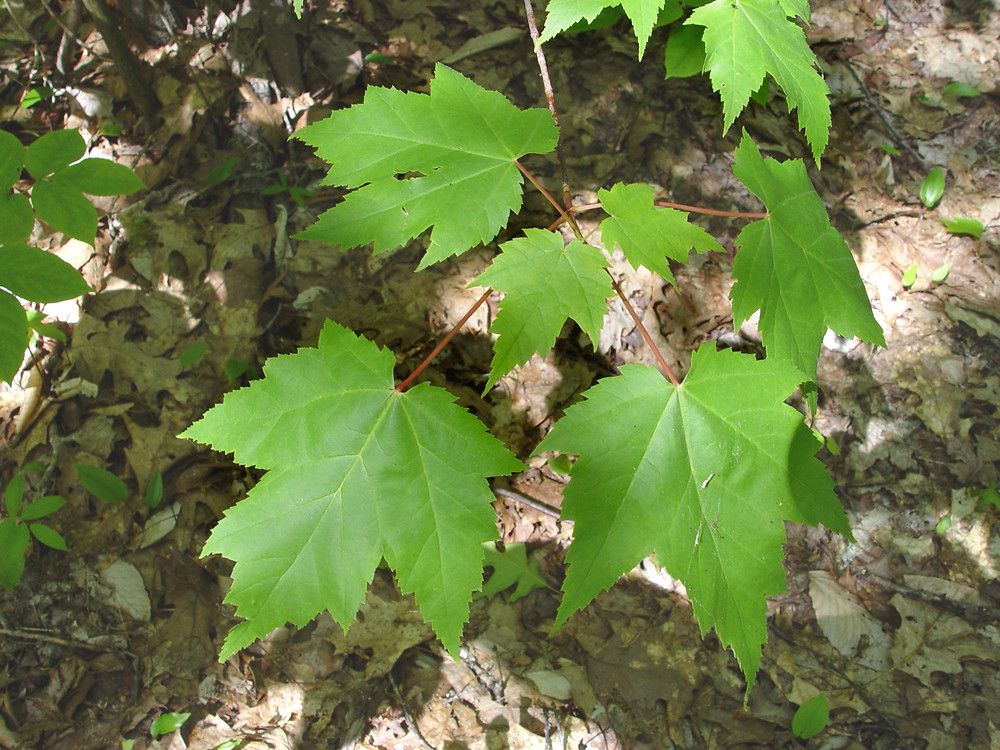
During the Spring 2019 semester, students in BIO 181 carried out the complete Urban Ecology/Scale Insect lab on the NCSU campus near David Clark Labs. Twelve Maple trees were sampled from two locations, six trees from Area A (south side of Dan Allen Parking Deck near railroad tracks), and six trees from Area B (north side of the Dan Allen Parking Deck between University Towers and David Clark Labs) . The data from 12 Red Maple trees was consolidated into the graph shown below.
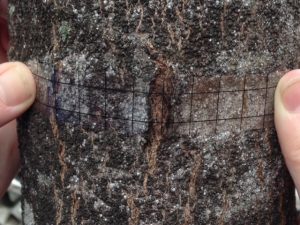
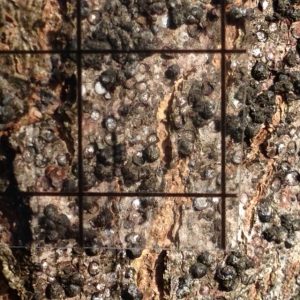
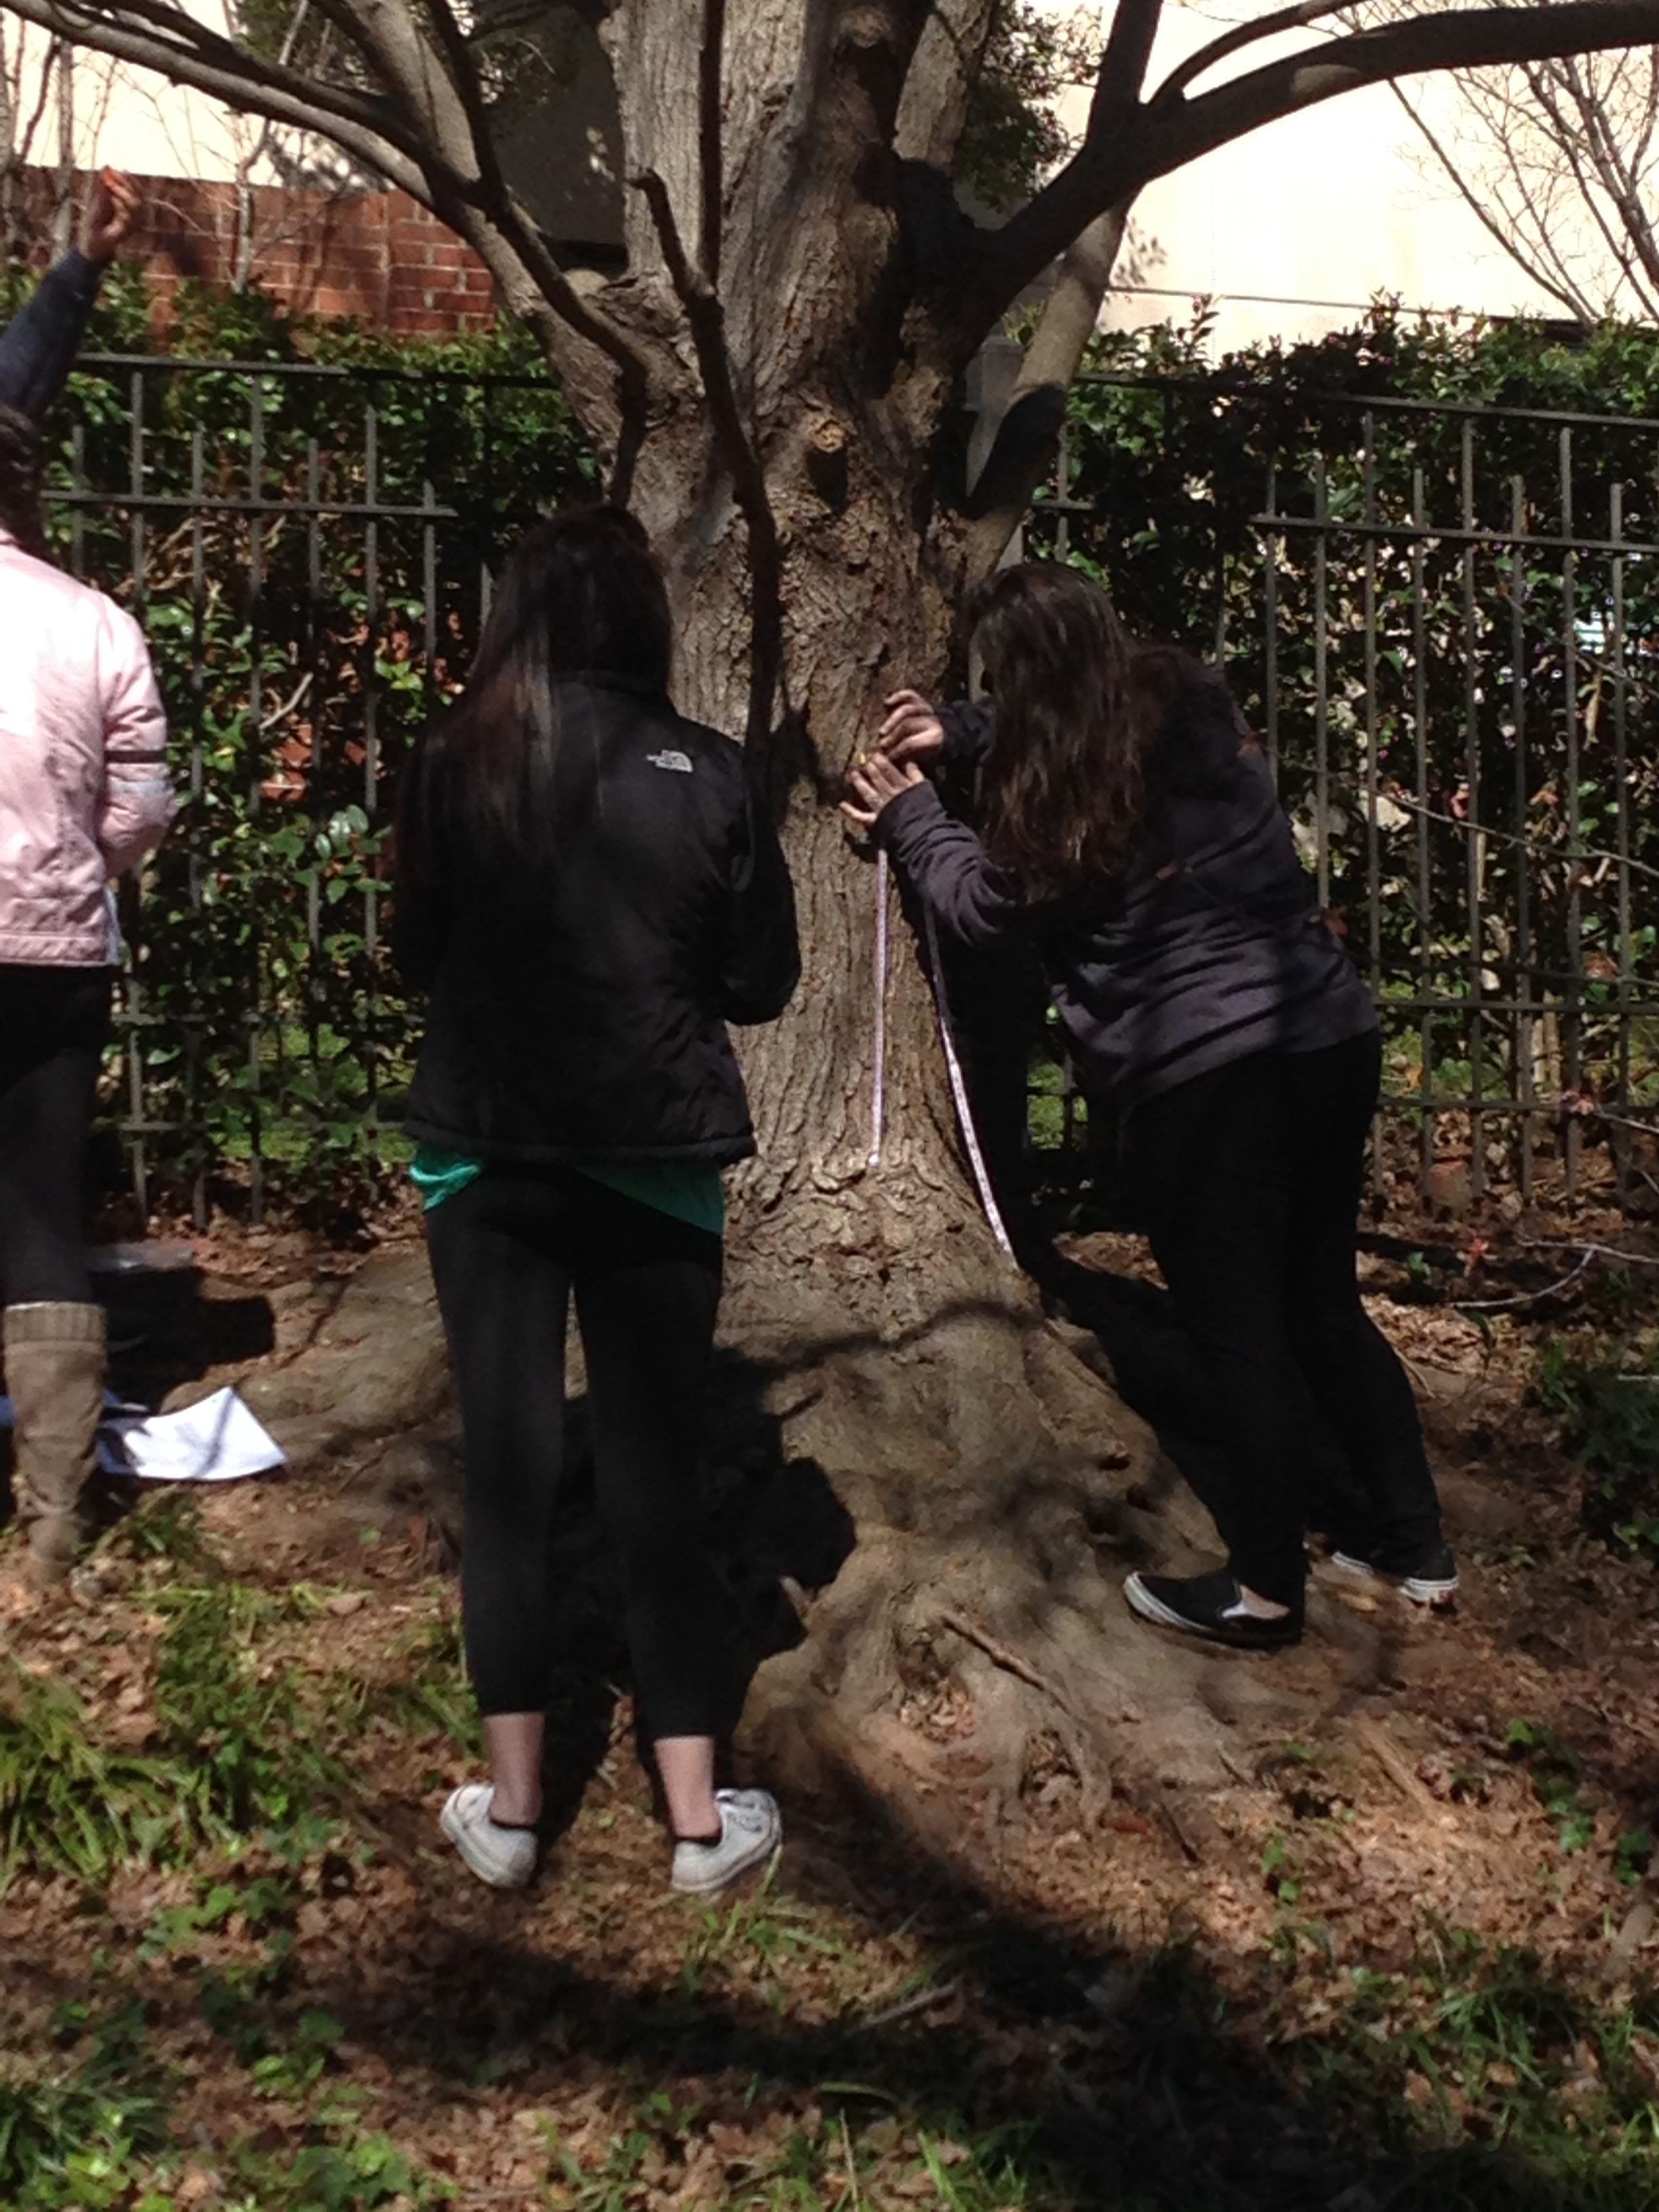
Above – images show the 1 x 10 cm clear grid used to determine gloomy scale coverage. Close up on 1 cm square.
Locations:
Area A: Six Red Maples were sampled on the south side of the Dan Allen Parking Deck on the NCSU campus near the railroad tracks.
 .
.  .
. 
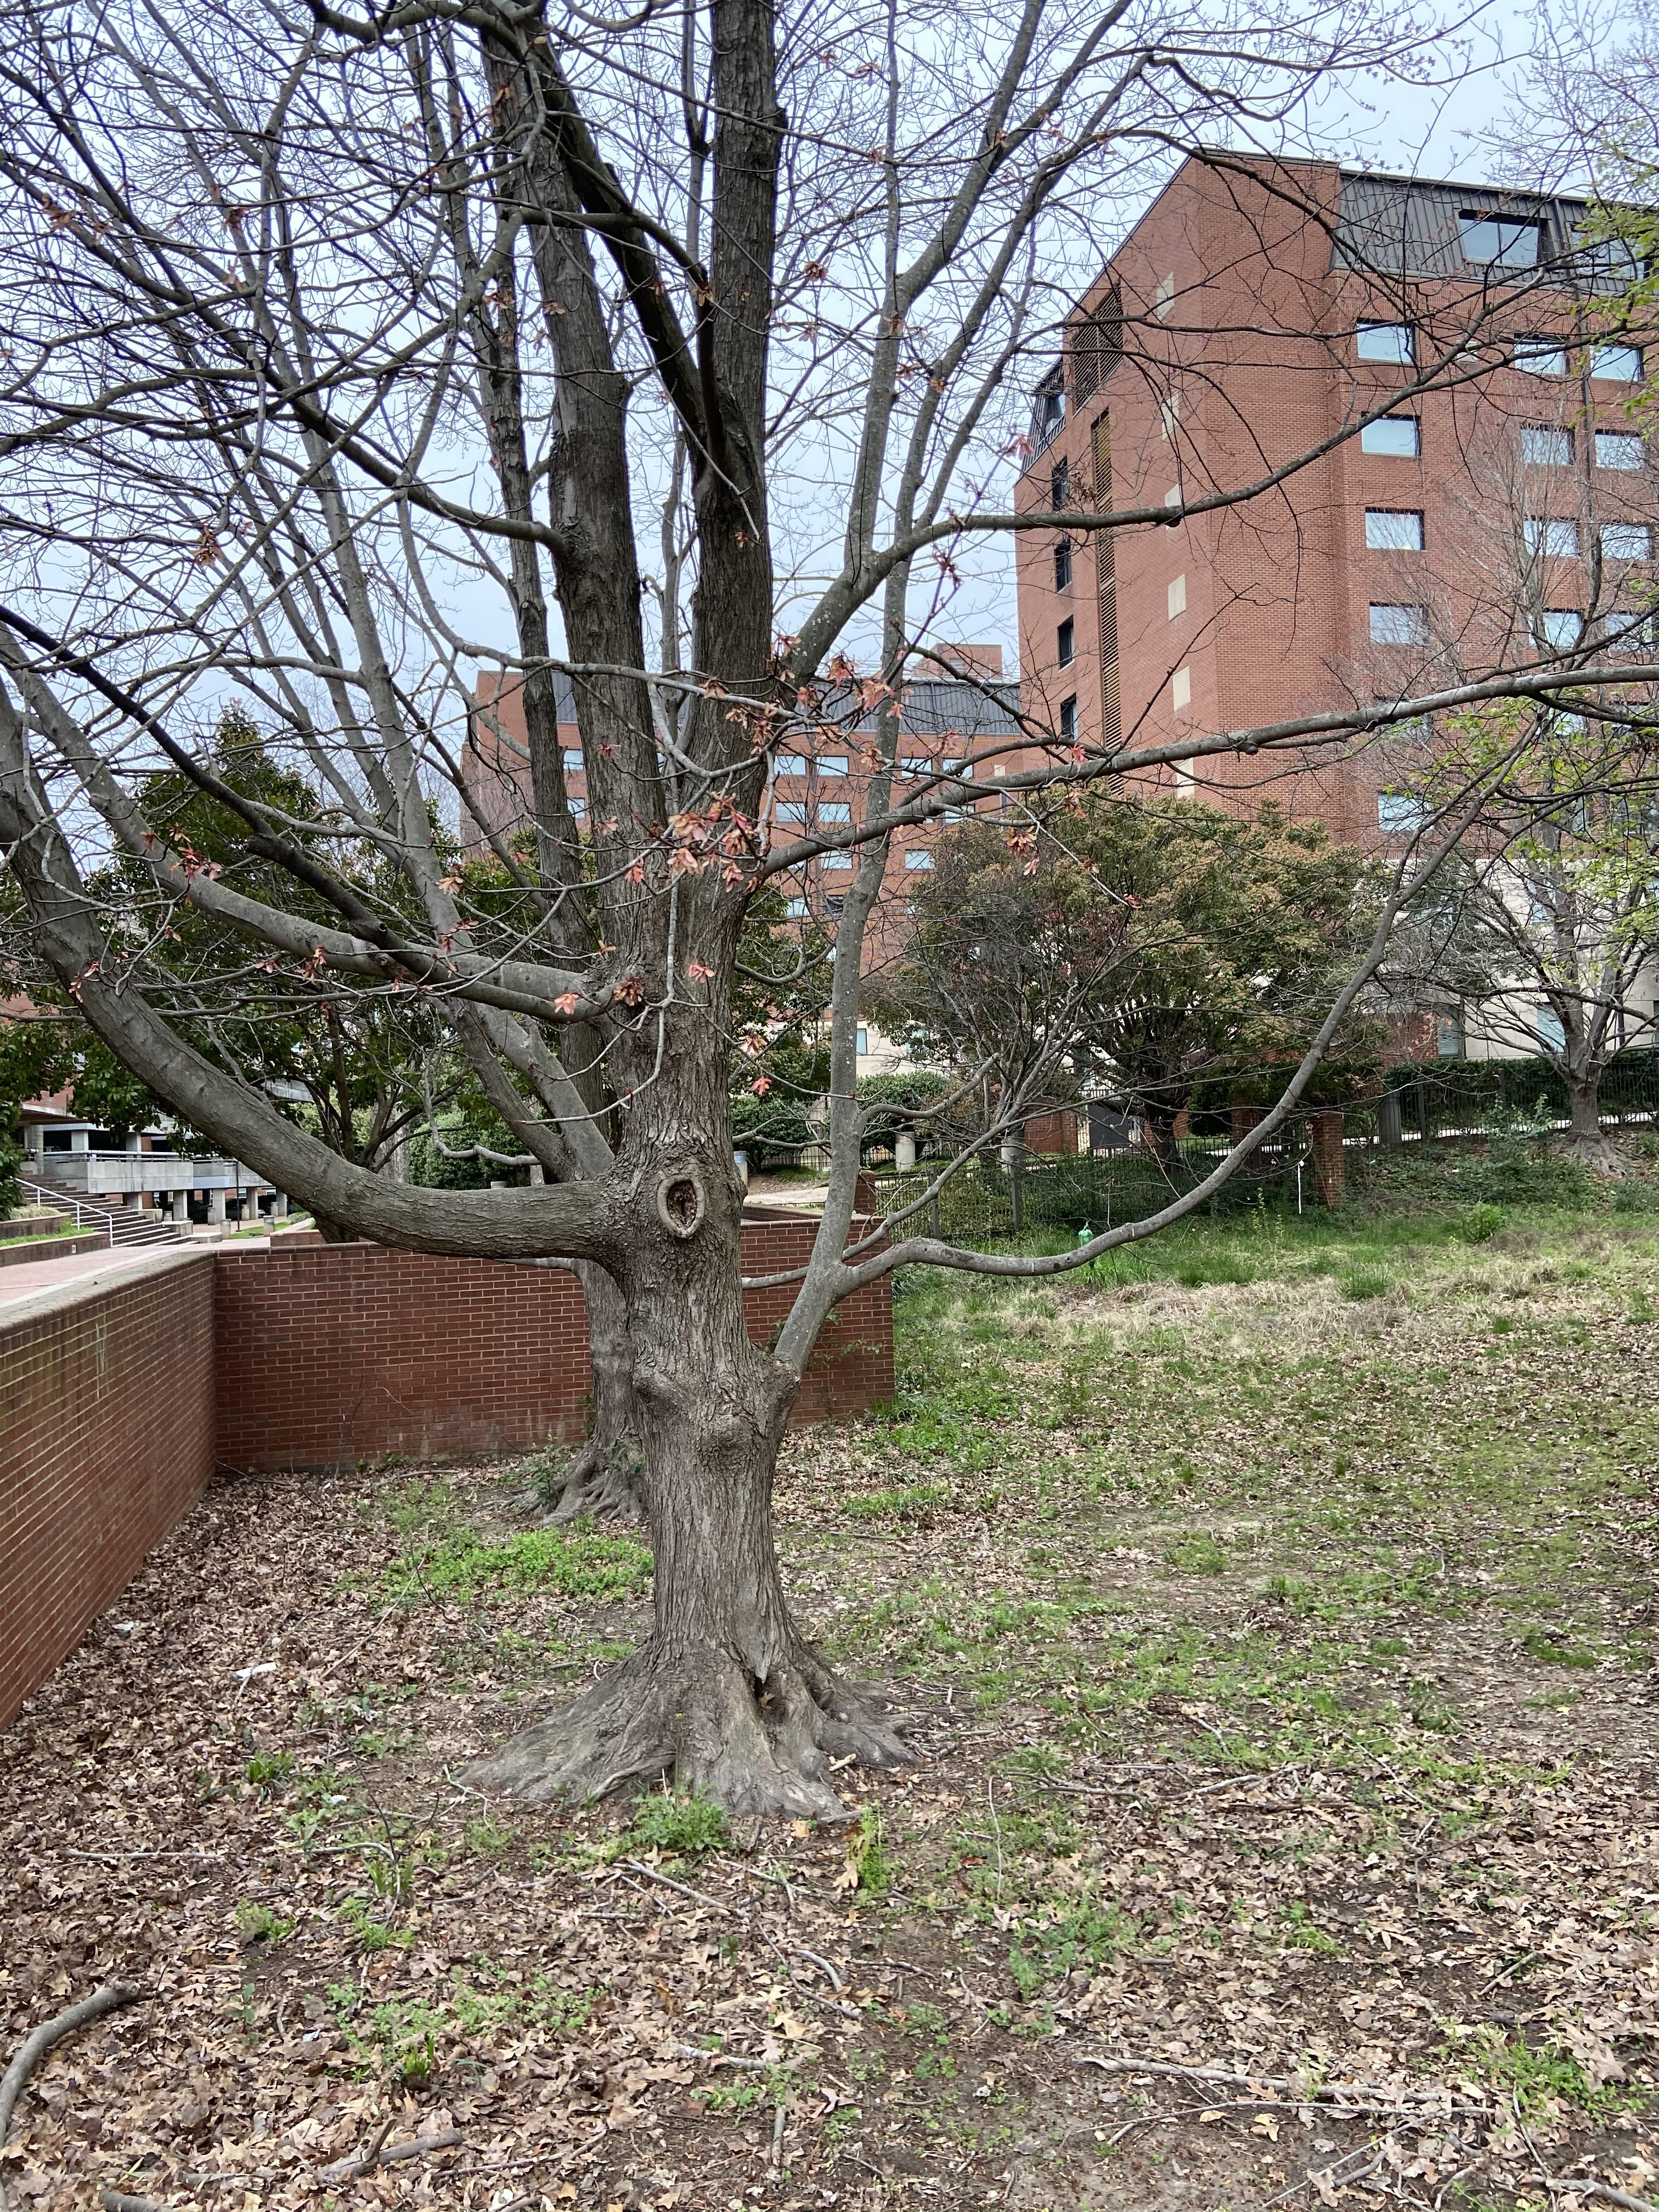
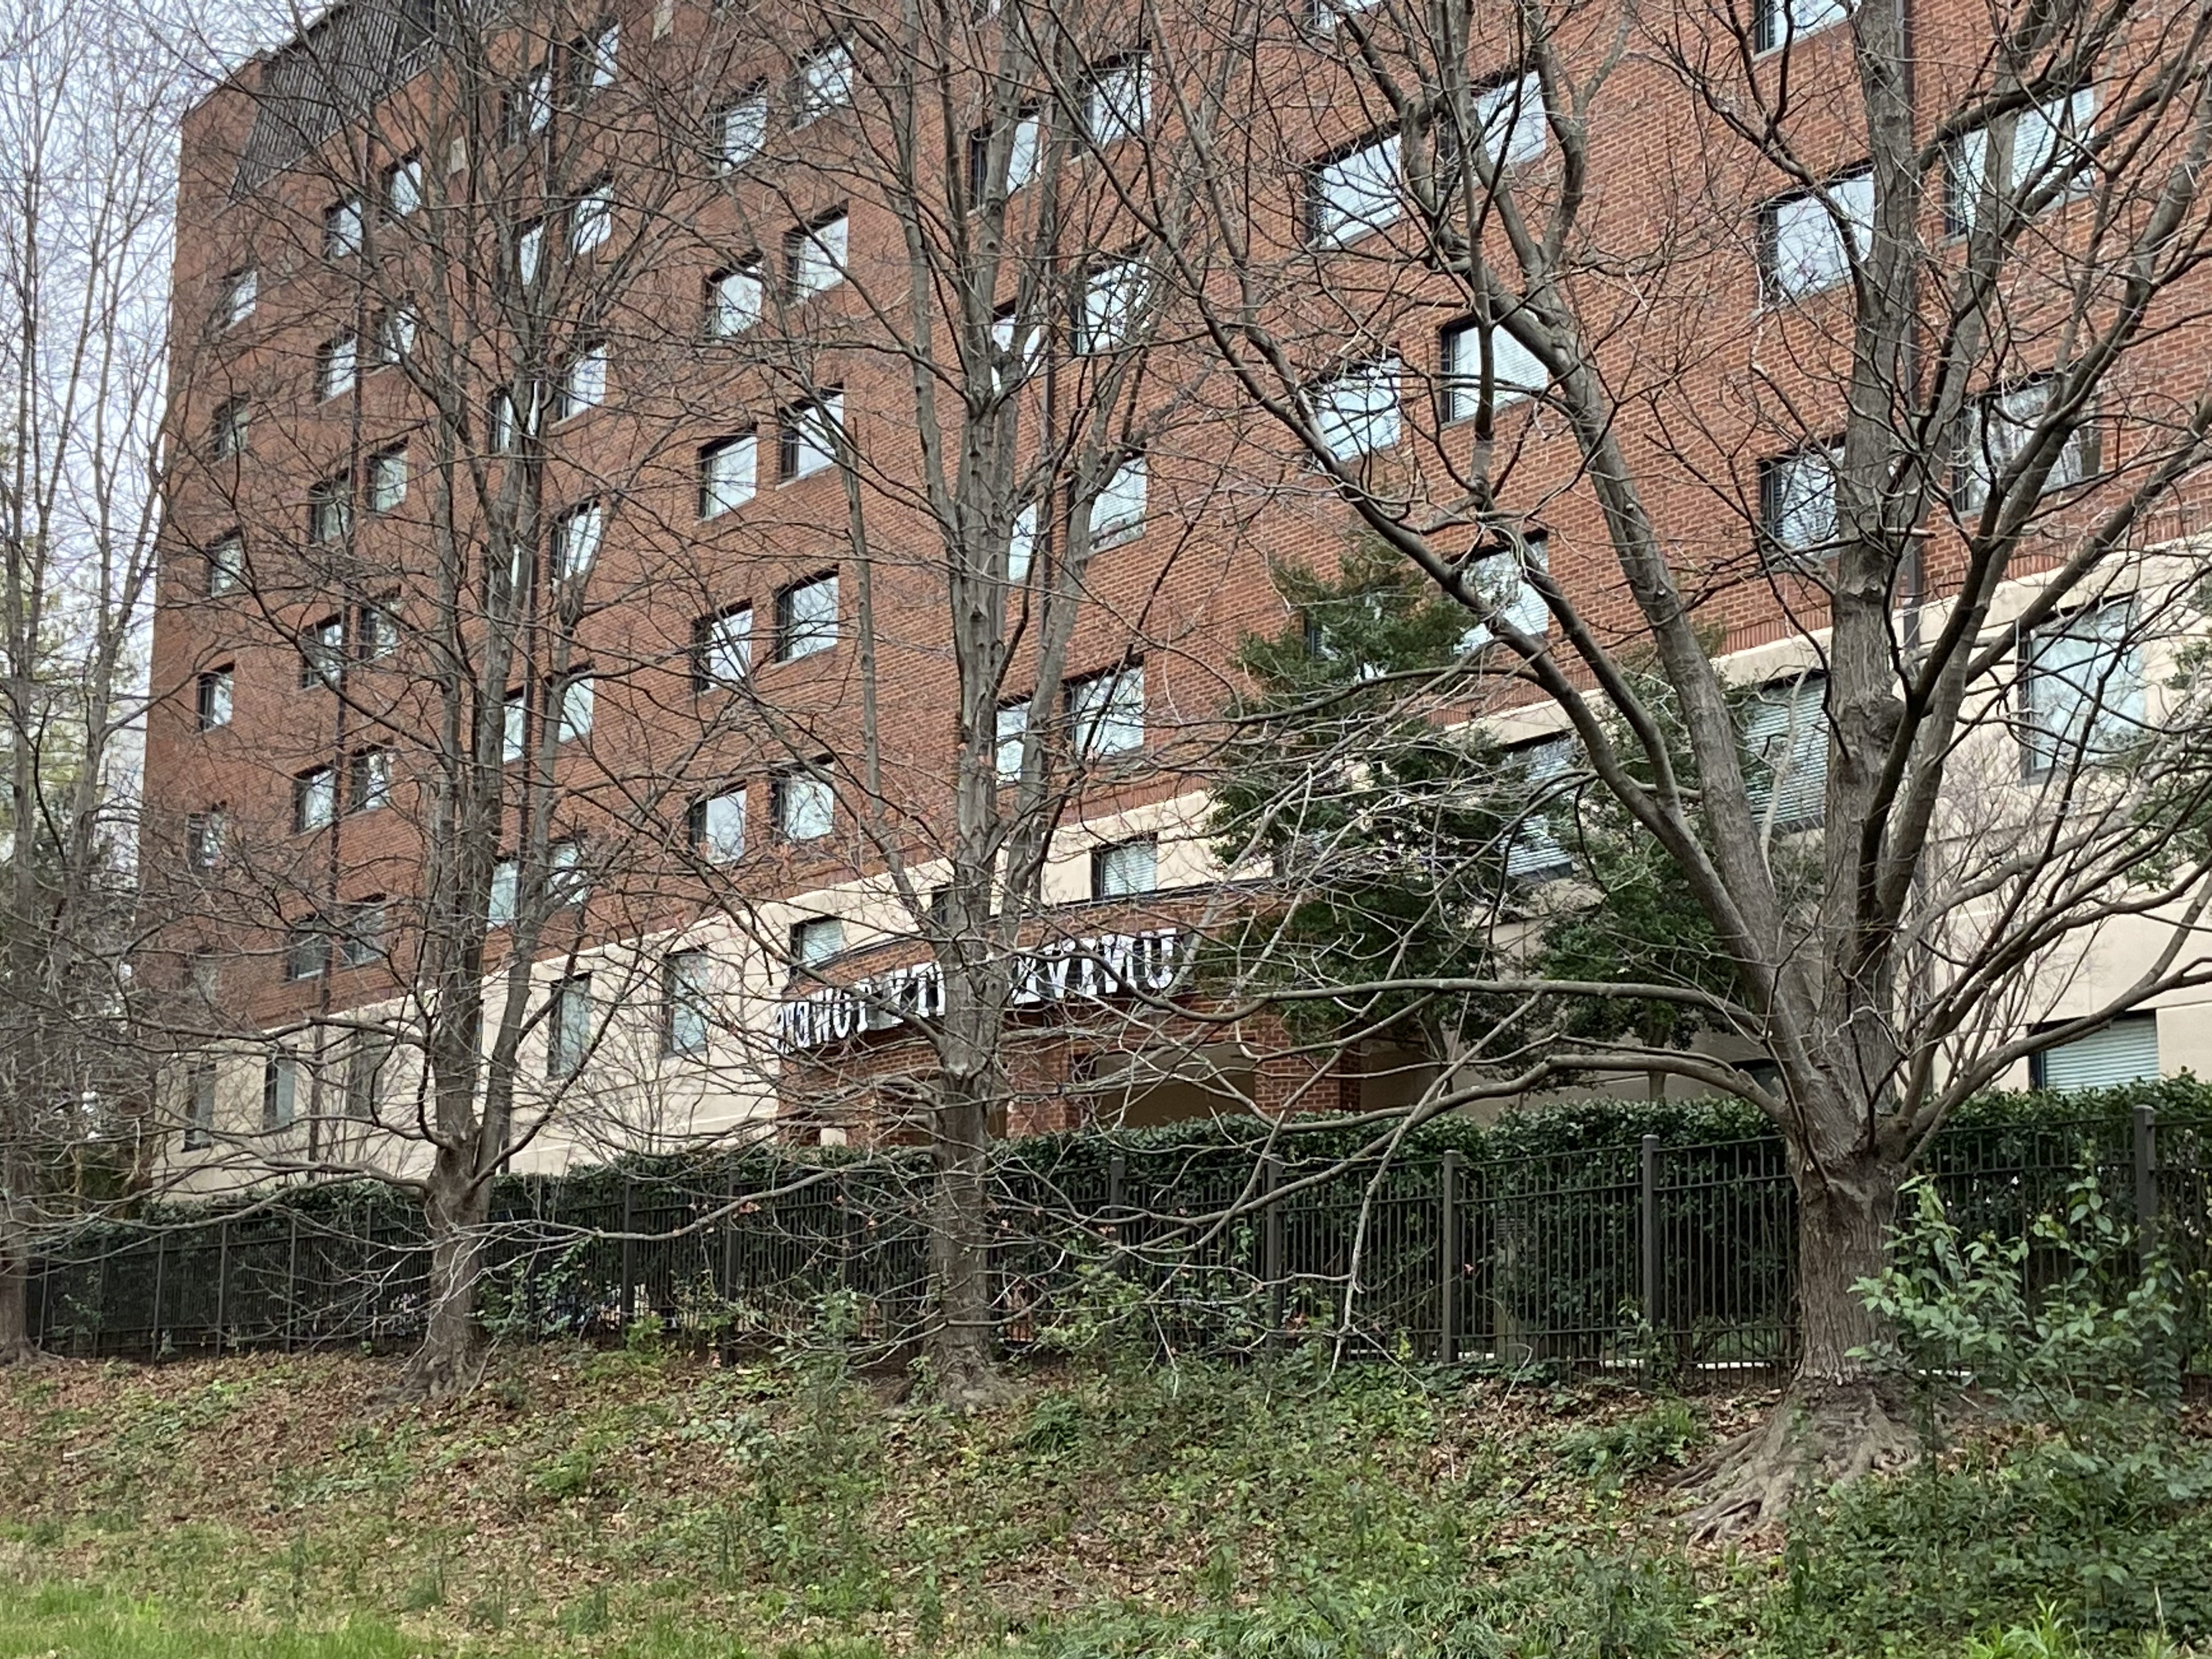
Area B: Six Red Maples were sampled on the north side of the Dan Allen Parking Deck between University Towers and David Clark Labs.
 .
.
 .
. 
Class graph of data collected from 12 trees in 2 locations Spring 2019
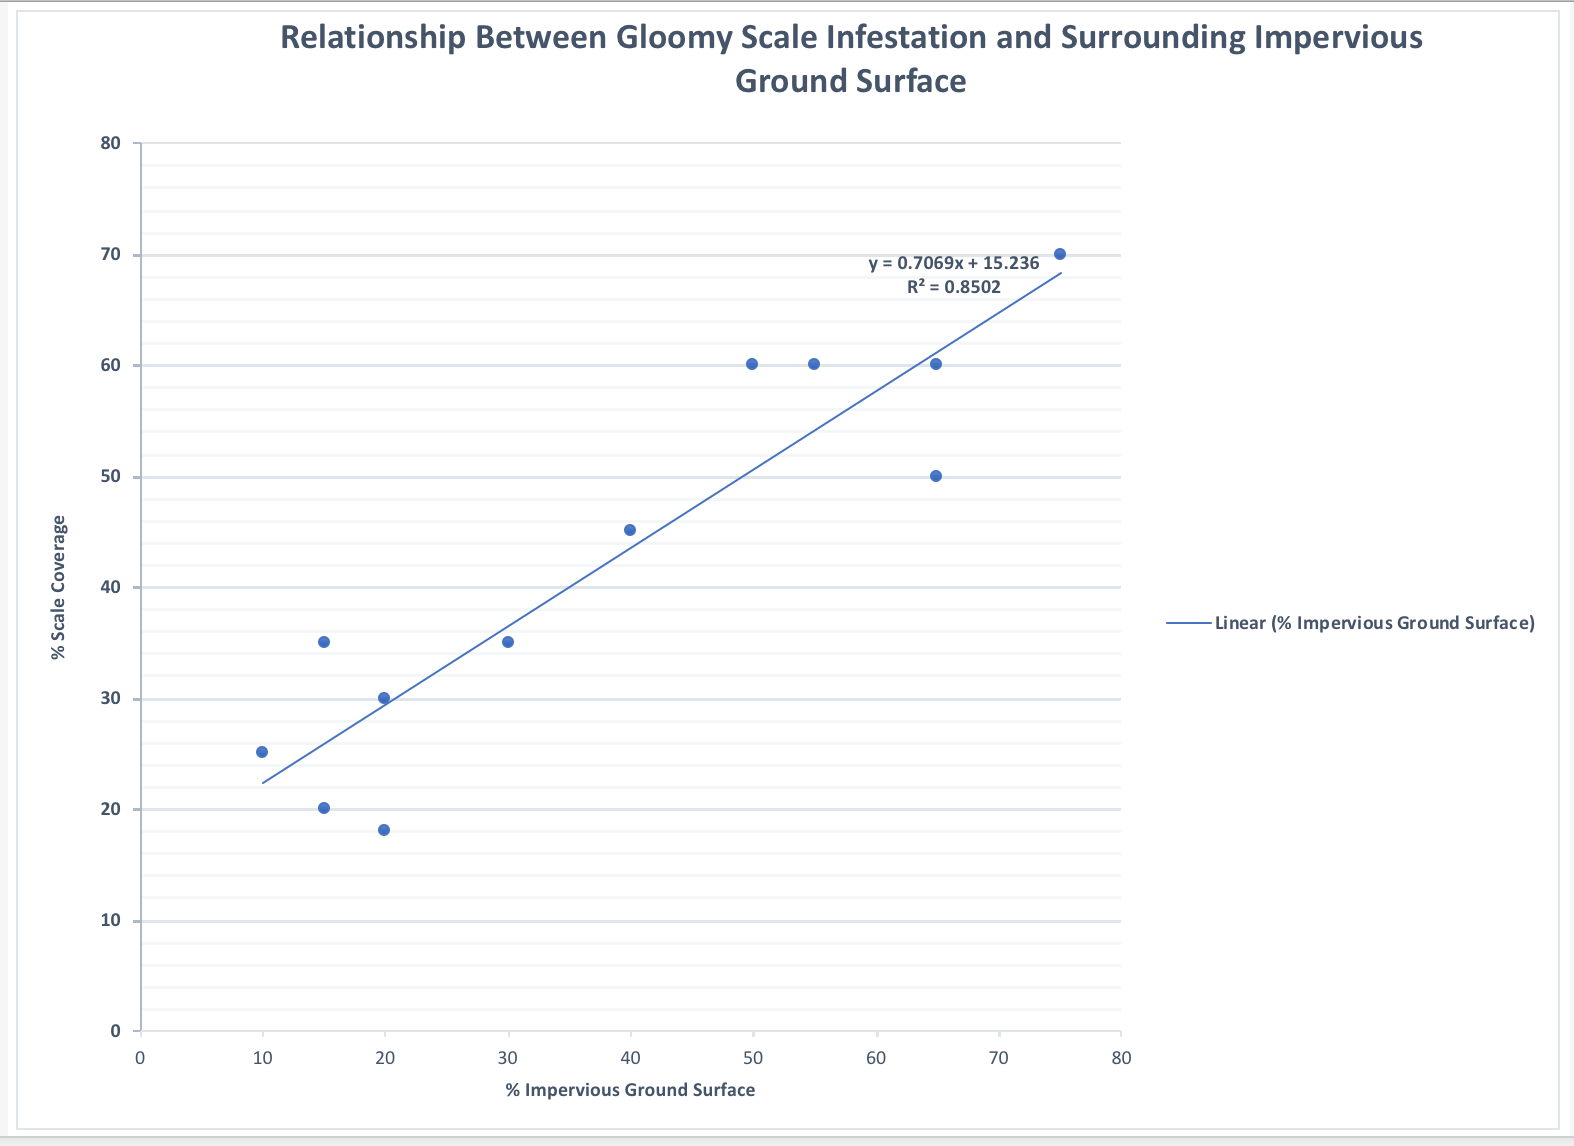
- Scale insect data graph interpretation:
- Based on these data above, what inferences can you make about scale insect infestation?
- How would you improve this graph?
- Describe what these findings may mean with regards to the impacts of urban tree planting practices?
- How do trees in Area B (the more natural area) differ from Area A, and what are some of the human impacts on both of these areas?
- Now that you have analyzed the graph above, how do the qualitative (observational) and quantitative data (table input) from the trees you sampled allow you to assess the health of the trees? That is, how can you assess whether or not the trees are thriving in the areas where they are located? Use the compiled data from your group members to make this assessment as a group.
- Based on the group data entered in the table below, what is the group’s assessment regarding the health of the trees that were sampled? You may want to consider:
- Do you see similar/different patterns in tree health in the more rural and/or urban areas? Did tree species seem to play a factor?
- What other types of organisms did you see living on or around trees in these different areas & trees.
- Do native or non-native tree species make a difference in overall tree health in either locations? What implications might this have on other organisms, especially local insects or other wildlife? or landscape management?
Overall health of your sampled trees? Your group answer should be written in at least 1-2 paragraphs.
4. Based on all of the data you have analyzed, evaluate the overall implications of urban tree planting practices, microclimates, human impacts on tree health, global warming, etc. Your group answer should be written in at least 2 paragraphs.
Be prepared to present your group Findings and inferences to all of your lab peers by the end of the activity.
The group should save the finished group work as a PDF before uploading the completed group data representations and inferences in Moodle for the Unit 4.2 In-Lab Group Assignment before leaving lab.
Written Scientific Communication
- Sample Lab Report – Nutrients in Various Foods(opens in new window) -note the format and how references are used and cited.
Activity: Evaluating a Lab Report
- Grading Lab Reports – Read the following student Lab Report – Optimal Foraging in Beavers
- Analyzing a lab report – Complete the provided Lab Report Grading Rubric individually.
- Be prepared to discuss and defend how you graded each section with your lab group and TA. What information is found in each section? How are references used? How are references cited?
- Guide to Analyzing Sections of a Lab Report – another helpful resource if you have questions about different sections of Lab Reports.
- Students will write an individual Ecology Lab Report on either Unit 4.1 or 4.2. The rubric your TA will use to grade your Ecology Lab Report is the same as this rubric, except for the point allocation.
- See the Writing Lab Reports resources below the yellow assignment boxes in the Post Lab.
- Complete questions 2-6 on pp. 69-70 and upload to Moodle as an individual assignment.
- NOTE: Start organizing a timeline for writing your lab report. The lab report assignment can be found at the callout box below OR from the Lab Schedule & Assignment webpage.
Writing Lab Reports – Use when writing the Ecology Lab Report – Lab Units 4.1 and 4.2
- Inside-Out-Approach to writing lab reports
- LabWrite Home
- Guide to Analyzing Sections of a Lab Report
- Sample Lab Reports –look at formatting AND how references are used and cited.
- PPT that shows common mistakes with plagiarism
- PowerPoint from a Workshop on Writing Lab Reports
- (PPT tells you the basics, but also addresses common mistakes and questions from past students.)
- Writing tips for Scientific Writing (Active/Passive Voice, Wordiness, References, Pronouns, Tense Issues, Syntax)
- View a Sample Scientific Journal Article – Honey Bee Article
Finding and Citing References in your Lab Report
- Check out the Resources page on the main Lab homepage to help with writing in-text citations and full references.
- 8th Edition CSE Scientific Style and Format Citation Quick Guide
Sample Scientific Papers – Primary vs. Secondary Literature
| Sample 1 -Mice | Sample 2 -Rhinos(opens in new window) | Sample 3 -Iguana(opens in new window) | Sample 4 -Ecosystem(opens in new window) | Sample 5 -Parasites(opens in new window) |
Additional help outside of the Biology Department and your TA
Additional NCSU research:
Forecasting the Effects of Heat and Pests on Urban Trees: Impervious Surface Thresholds and the ‘Pace to Plant’ Technique
From Oct. 5, 2016 NCSU Bulletin – Urban Warming Slows Tree Growth, Photosynthesis – mentions increased insect pests are part of the problem.
Lack of Water is a Key Stressor for Urban Trees – more NCSU research Mar. 13, 2018
Tree Health and Urban Ecology:
13 Steps for evaluating tree health
Storm damage to landscape trees from NC State’s Extension program
What Tree Should be Planted from NC State’s Extension program
Resources for Tree and Organism Identification: Here are some resources in the form of links
and applications (some of these apps are not free, but you can search for your own online too):
Winter Tree Identification
Winter Tree ID Key – nice handout with diagrams for twig tip anatomy and terminology
NC Tree Identification from NC State’s Extension program
Trees – NC State Resources Extension Program
ChopDoc – list of apps for tree identification by leaves and bark
Seek by iNaturalist – app that helps you identify organisms
MyNature Tree Guides:
For Android: https://www.amazon.com/MyNature-Inc-Tree-Guide/dp/B00CJ1OYV4
For iPhone http://www.mynatureapps.com/mynature-tree-guide/
iBird: http://ibird.com/#
Peterson’s Bird Guide: http://petersonguides.com/apps/apps.php
Merlin Bird ID: https://merlin.allaboutbirds.org/
Audubon Bird Guide App: https://www.audubon.org/app
Butterfly Collection – app for identifying butterflies and other insects: